FIGURE SUMMARY
Title

Thyroid hormone receptors in two model species for vertebrate embryonic development: chicken and zebrafish

Authors
Darras, V.M., Van Herck, S.L., Heijlen, M., and De Groef, B.
Source
Full text @ J. Thyroid Res.

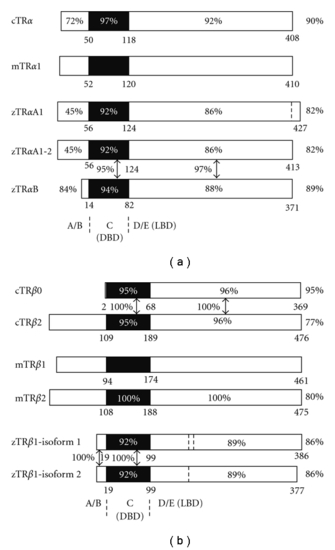
Comparison of mouse (m), chicken (c), and zebrafish (z) TR isoforms. (a) TRα variants and (b) TRβ variants. Truncated TR isoforms that do not bind T3 are not included, nor are the TRβ3 variants that have only been found in rats. Numbering of amino acids is represented under each bar. Percentages within the bars are identities of that domain with the homologous domain of mTRα1 or mTRβ1, respectively. Percentages right of the bars give the overall similarity of the entire protein with the canonical mouse homolog. Percentages in between bars show the similarity between the respective domains. A/B: A and B domain; C (DBD): C domain or DNA-binding domain; D/E (LBD): D and E domain or ligand-binding domain. The dotted line in the D/E domain of zTRαA1 marks the first of the 14 additional carboxy-terminal amino acids not found in the other TRs. The dotted lines in the D/E domain of zTRβ1 isoform 1 delineate a 9-amino-acid insert that is missing in the equivalent location in zTRβ1 isoform 2 (also indicated with a dotted line). Comparisons were based on the following UniProtKB sequences: mTRα1 (P63058-2), mTRβ1 (P37242-1), mTRβ2 (P37242-2), cTRα1 (P04625), cTRβ0 (P68306), cTRβ2 (Q91003), zTRαA1 (Q98867-1), zTRα1-2 (Q98867-2), zTRαB (A0ST48), zTRβ1-isoform 1 (Q9PVE4-1), and zTRβ1-isoform 2 (Q9PVE4-2).

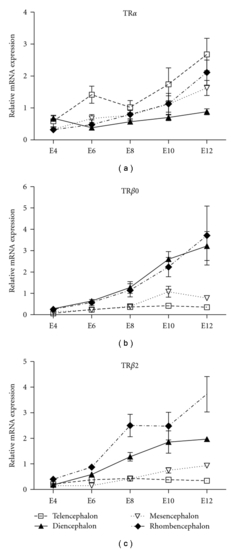
Ontogenetic pattern of TRα, TRβ0, and TRβ2 expression in different brain regions of 4- to 12-day-old chick embryos. Specific mRNA levels were measured by qRT-PCR and normalised against a combination of four housekeeping genes: β actin, GAPDH, β2 microglobulin, and cyclophilin A. Values represent the mean ± SEM for 6 independent samples per stage.

Expression of TRαA and TRβ in whole zebrafish embryos during the first three days post fertilisation. Specific mRNA levels were measured by qRT-PCR and normalised against the housekeeping gene Elongation factor 1α. Values represent the mean ± SEM for 3 independent samples (pools of 50–100 embryos) per stage. The arrow indicates the average time of hatching. HPF: hours post fertilisation. Data were taken from [7, 25].

Acknowledgments
This image is the copyrighted work of the attributed author or publisher, and ZFIN has permission only to display this image to its users. Additional permissions should be obtained from the applicable author or publisher of the image. Full text @ J. Thyroid Res.