
- Title
-
Spatiotemporal compartmentalization of key physiological processes during muscle precursor differentiation
- Authors
- Ozbudak, E.M., Tassy, O., and Pourquié, O.
- Source
- Full text @ Proc. Natl. Acad. Sci. USA
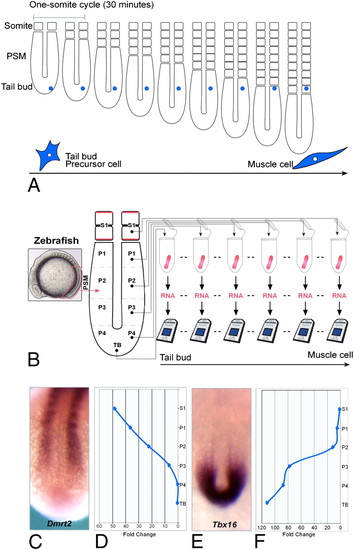
Generation of a microarray time series covering early stages of muscle differentiation in the zebrafish embryo. (A) A descendent of the tail-bud precursor cells (blue cell) enters the PSM posteriorly and progressively matures as it become located more and more anteriorly in the PSM during axis elongation. The cell eventually becomes incorporated into a somite, where most cells differentiate into muscles in zebrafish embryos. (B) Generation of the microarray time series. (Left) Lateral view of a 12-somite zebrafish embryo showing the position of the PSM (pink box). The samples used for the microarray time series were collected from six consecutive spatial positions in the PSM and recently formed somites on both sides of an embryo. Microarray expression profiles (D and F) faithfully recapitulate the expression of Dmrt2 (C) and Tbx16 (E) detected by in situ expression in 15-somite zebrafish embryos. Expression levels (D and F) were normalized by the expression levels in the tail bud (TB) and the somites (S1), respectively, to show the fold increase or decrease, respectively, along the spatial axis. |

Biological validation of the compartmentalization of cell cycle/DNA metabolism and translation/oxidative metabolism along the PSM. (A) The DNA content of tail bud cells (orange) is compared against the last six-to-eight formed somites (blue) from both the Left and Right sides. P values from the one-tail t test are 0.00019, 0.00043, and 0.0589 for the three phases, respectively. Standard deviations are plotted in the panel. (B) The ratio of different measurements (values are obtained from cells in the anterior locations and divided by those in the posterior locations) are shown in histograms. The total protein level (green) is increased in the anterior sections of the embryo 1.8-fold and 2.5-fold, at the spatial position: somites 1 to 5 (S 1–5) or somites 6 to 10 (S 6–10), respectively, compared with that of the posterior PSM. The ATP level (purple) is increased 2-fold in somites 1 and 2 (S 1–2) compared with the tail bud. The cytochrome-C oxidase activity level (blue) is also increased in the last five formed somites (S 1–5) by 2.5-fold compared with the posterior PSM. H2O2 level (pink) also progressively increases in the anterior sections of the embryo from 2.3-fold and 4.3-fold, at spatial position: somites 1 to 5 (S 1–5) or somites 6 to 10 (S 6–10), respectively, compared with that of in the posterior PSM. All ratios were obtained by normalizing by DNA content in the respective samples. Error bars represent SEM. (C) A representative zebrafish embryo stained with MitoTracker Orange CM-H2TMROS. (D) y axis shows the intensity of fluorescence measured along the anterioposterior axis through the yellow line in C from somites (A, anterior) to the tail bud (P, posterior). |
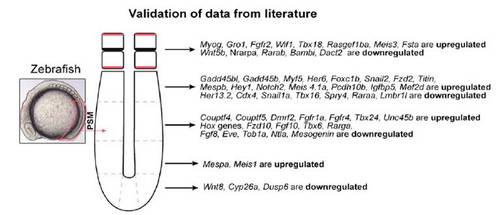
Validation of data from the literature. Genes are marked, depending after which spatial point their levels are significantly increased or decreased (compared with the initial time point; tail bud) with 10% false-discovery rate and 1.5-fold change. The results can be compared with those from the ZFIN database online (http://zfin.org/cgi-bin/webdriver?MIval=aa-xpatselect.apg). |