
FIGURE SUMMARY
- Title
-
Crosstalk between planar cell polarity signaling and miR-8 control of NHERF1-mediated actin reorganization
- Authors
- Flynt, A.S., and Patton, J.G.
- Source
- Full text @ Cell Cycle
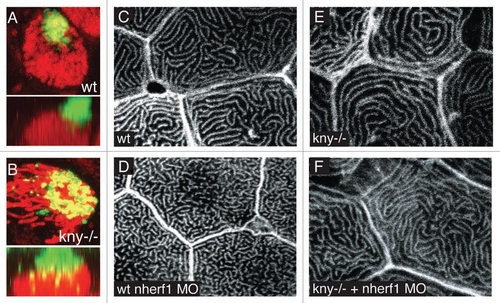
Nherf1 and Planar Cell Polarity. (A and B) Live imaging of zebrafish ionocytes using ConA-FITC and MitoTracker red labeling in wildtype and knypek (kny-/-) mutants. Top panels show a view of a single cell on the surface of the yolk sac, bottom panels show a side view of the z-stack depicting apical trafficking. (C and D) Phalloidin-Cy3 staining of zebrafish epidermal cells (keratinocytes) in fixed embryos from uninjected wildtype and nherf1 MO injected animals. (E and F) Staining in kny-/- animals, either uninjected (E) or injected with the nherf1 MO (F). |
Acknowledgments
This image is the copyrighted work of the attributed author or publisher, and
ZFIN has permission only to display this image to its users.
Additional permissions should be obtained from the applicable author or publisher of the image.
Open Access.
Full text @ Cell Cycle