
- Title
-
Optical control of zebrafish behavior with halorhodopsin
- Authors
- Arrenberg, A.B., Del Bene, F., and Baier, H.
- Source
- Full text @ Proc. Natl. Acad. Sci. USA
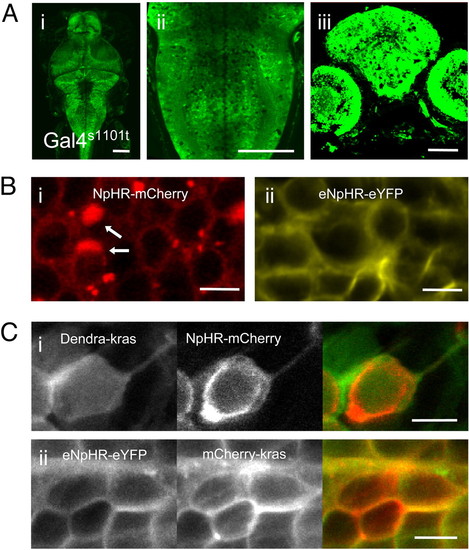
Expression of NpHR in zebrafish. (A) Expression pattern of Gal4s1101t; UAS:Kaede transgenic animals. Dorsal view (i), horizontal optical slice through the hindbrain (ii) and transverse section through the eyes and midbrain (iii) of 5 dpf animals. (B) Expression of NpHR in Gal4s1101t; UAS:(e)NpHR-XFP animals. (i and ii) NpHR-mCherry and eNpHR-eYFP, respectively. Intracellular blebs (arrows) are labeled in (i). (C) Surface targeting of NpHR. Co-expression of membrane-bound Dendra-kras and NpHR-mCherry in Gal4s1013t; UAS:Dendra-kras; UAS:NpHR-mCherry animals (i) reveals suboptimal surface targeting. Co-expression of eNpHR-eYFP and membrane-bound mCherry-kras in Gal4s1013t; UAS:eNpHR-eYFP; UAS:mCherry-kras animals, shows complete surface targeting of eNpHR-eYFP. [Scale bars, 100 μm in (A); 5 μm in (B and C).] |
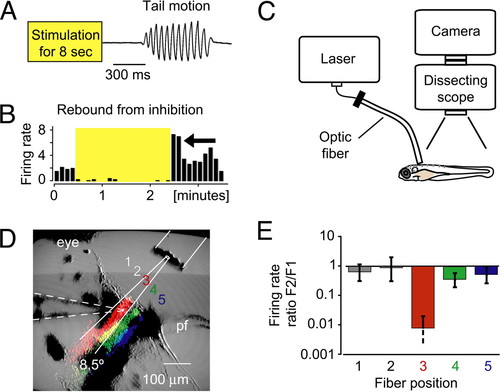
Use of fiber optics to control locomotion with NpHR. (A) Release from NpHR activation induced locomotion in head-restrained animals. The tail deflection is plotted over time. (B) The recorded cell showed an above-average firing rate directly after the stimulation (yellow shaded box) was stopped (arrow). (C) Fiber-optic setup for the mapping of the locomotion phenotype. An optic fiber was coupled to a laser and placed over the head-restrained larva with a micromanipulator. (D and E) Spatially defined light application was feasible with optic fibers. (D) The optic fiber (10-μm inner core diameter) was moved across the recorded cell in five steps. False-colored stripes in the image represent the scattered light that was detected by the camera when light was sent through the fiber at positions 3–5. The stripes of scattered light approximately match the theoretical divergence angle of the fiber (8.5°, white solid lines). Dashed lines outline the position of the electrode. pf, pectoral fin. (E) The firing rate ratio F2/F1 of a single cell is plotted for different fiber positions. The cell was only silenced when it was directly illuminated, which demonstrated the precise light application with optic fibers. |
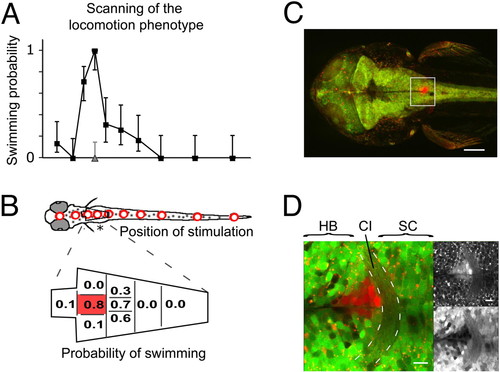
Mapping of the locomotion phenotype that was induced by rebound from NpHR silencing (A) The probability of observing a forward swim is plotted versus the position of stimulation (200-μm optic fiber) in 3 dpf zebrafish. Mean probabilities of NpHR-mCherry expressors (black) and siblings (gray, only third position) are shown with 95% confidence intervals (Wilson score interval for binomial distributions). (B) The hindbrain region in (A) (asterisk) was mapped in detail with a 50-μm fiber. The probability was maximal in a small area along the midline just caudal to the pectoral fins. A total of 295 trials was analyzed in (A) and (B) (n = 7 animals). (C) The phenotype was mapped in an animal transgenic for Gal4s1101t; UAS:NpHR-mCherry; UAS:Kaede. The region where the animal responded reliably was illuminated with UV light to photo-convert Kaede. (D) Close-up of the box in (C). A narrow column of tissue was converted, labeling only a few cells in every optical section. The maximal response probability was found in the region of the commissura infima Halleri (CI, dashed lines), which demarcates the border between spinal cord (SC) and hindbrain (HB). The upper right shows the red channel and the lower right the green channel. [Scale bars, 100 μm in (C) and 10 μm in (D).] |
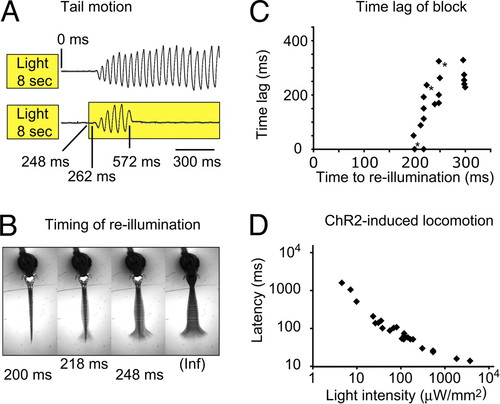
Kinetics of the rebound-evoked swim command. (A) The NpHR induced forward swimming was blocked by reactivating NpHR. Top: Without reactivation of NpHR, the animal (5 dpf) started to move 267 ± 3.5 ms (SEM) after the light had been turned off and continued to swim for 3.6 ± 0.3 s (SEM). Bottom: When the animal was re-illuminated after 248 ms, the locomotion that had started after 262 ms was blocked at t = 572 ms. (B) The amplitude and duration of the tail contractions depended on the re-illumination time point. Early re-illuminations permitted only smaller amplitudes (see also Movie S4). Images are an average-z-projection of four consecutive minimum-intensity-z-projections. (C) The time difference between the cessation of locomotion and the re-illumination is plotted versus the re-illumination time point. Intervals shorter than 190 ms never permitted tail contractions. Between 190 ms and 250 ms the time difference increased rapidly and approached a maximum value of 263 ± 14 ms (SEM) at 300 ms. Trials in (B) are labeled with an asterisk in (C). (D) In ChR2 expressing animals, the response latency depended on the illumination intensity. Stronger illuminations elicited shorter latencies. Trials from a single 3-dpf animal are plotted. |
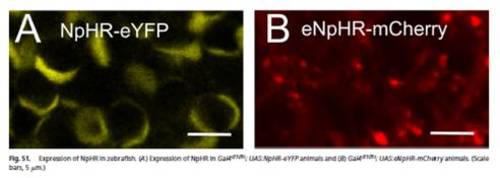
Expression of NpHR in zebrafish. (A) Expression of NpHR in Gal4s1101t; UAS:NpHR-eYFP animals and (B) Gal4s1101t; UAS:eNpHR-mCherry animals. (Scale bars, 5 μm.) |
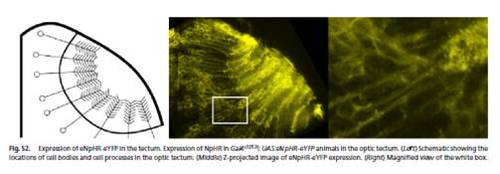
Expression of eNpHR-eYFP in the tectum. Expression of NpHR in Gal4s1013t; UAS:eNpHR-eYFP animals in the optic tectum. (Left) Schematic showing the locations of cell bodies and cell processes in the optic tectum. (Middle) Z-projected image of eNpHR-eYFP expression. (Right) Magnified view of the white box. |
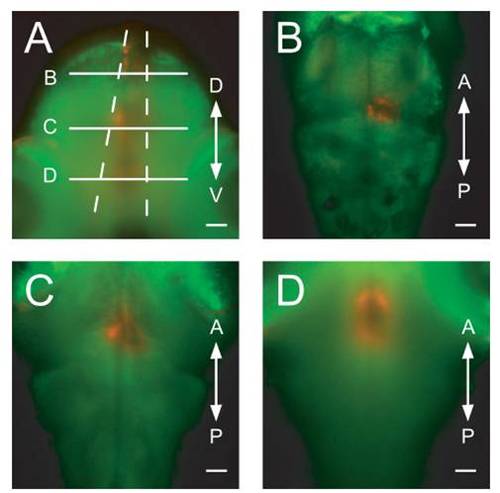
Confirmation of precise light application with optic fibers. A Gal4s1101t; UAS:Dendra-kras animal was imaged from two orthogonal directions, after Dendra had been converted with an optic fiber (50-μm diameter) placed over the dorsal surface of the animal. (A) Transverse view. The converted cone of red cells is visible. Dashed lines represent the theoretical divergence angle for 50-μmfibers and (B–D) indicate the positions of the optical sections in the panels (B–D). (B–D) Horizontal optical sections at the positions indicated in panel (A). D, dorsal, V, ventral, A, anterior, and P, posterior. (Scale bars, 50 μm.) |
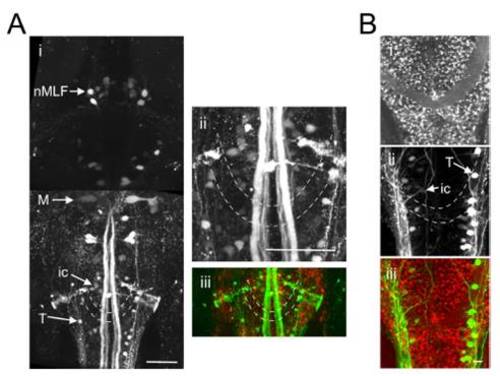
The caudal reticular formation is located in the vicinity of the commissura infima Halleri. (A and B) Two Gal4s1101t; UAS:NpHR-mCherry animals in which a green dextran-conjugated dye was injected into the spinal cord to label reticulospinal cells. (Ai) Dorsal view, extending from the rostral spinal cord (Bottom) to the midbrain (Top). ic and T cells of the caudal reticular formation are located in close proximity to the commissura infima Halleri (dashed lines). M, mauthner cell, nMLF, nucleus of the medial longitudinal fasciculus. (ii) Magnified view of the region containing the ic and T cells. (iii) Merged channels image. (B) Red channel (i), green channel (ii) and merged channels (iii). |
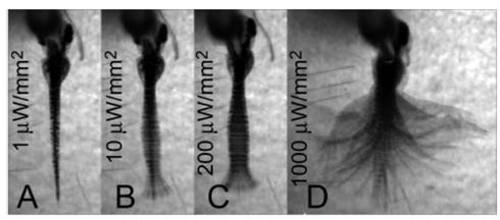
Locomotion latency and amplitude is dependent on light intensity in ChR2 animals. (A–D) The caudal hindbrain of a Gal4s1101t; UAS:ChR2-eYFP animal was illuminated (200-μm optic fiber) with different light intensities. Images are an average-z-projection of four consecutive minimum-intensity z-projections. See Movie S5. |