

Gene expression patterns obtained by fluorescence in situ hybridisation utilising the confocal laser scanning microscope correspond to expression patterns obtained using bright-field microscopy. Whole-mount dissected zebrafish brains labelled for gene expression patterns (red) were first photographed using bright-field microscopy (A, C, E) and then visualised using the confocal laser scanning microscope by collecting Z-series images (B, D, F). (A, B) pax6 expression at 20 hpf. (C, D) shh expression at 16 hpf. (E, F) otx2 expression at 18 hpf. Borders of gene expression (arrows), regions of low expression (asterisks), and regions of high expression (arrowheads) corresponded in both bright-field and fluorescent images. Bar, 50 μm. |

Confocal laser scanning microscope Z-series images of lateral views of whole-mount zebrafish brains showing the expression patterns of regulatory genes (red) at 16 (A, C, E, G) and 24 hpf (B, D, F, H). Rostral is to the right and dorsal is to the top. The outline of the brain is indicated by a dotted line. (A, B) pax6 expression in the zebrafish brain at 16 and 24 hpf. (C, D) shh expression in the zebrafish brain at 16 and 24 hpf. (E, F) nkx2.2 expression in the zebrafish brain at 16 and 24 hpf. (G, H) dlx2 expression in the zebrafish brain at 16 and 24 hpf. (H) dlx2 expression at 24 hpf. or, optic recess. Scale bar (A–H), 50 μm. |
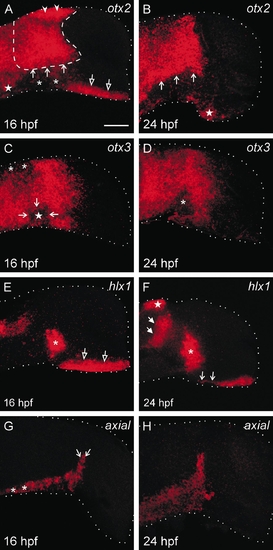
Confocal laser scanning microscope Z-series images of lateral views of whole-mount zebrafish brains showing the expression patterns of regulatory genes (red) at 16 (A, C, E, G) and 24 hpf (B, D, F, H). Rostral is to the right and dorsal is to the top. The outline of the brain is indicated by a dotted line. (A, B) otx2 expression in the zebrafish brain at 16 and 24 hpf. (C, D) otx3 expression in the zebrafish brain at 16 and 24 hpf. (E, F) hlx1 expression in the zebrafish brain at 16 and 24 hpf. (G) axial expression in the zebrafish brain at 16 and 24 hpf. Scale bar (A–H), 50 μm. |

The first neurons and axons of the zebrafish brain exhibit a dynamic spatial relationship to gene expression domains. Confocal laser scanning microscope Z-series images of lateral views of whole-mount zebrafish brains ages between 16 and 20 hpf double labelled for the expression of the HNK-1 epitope (green) and (A) shh, (B) dlx2, (C) nkx2.2, (D) pax6, (E) otx2, and (F) otx3 in red. Rostral is to the right and dorsal is to the top. drc, dorsorostral cluster; DVDT, dorsoventral diencephalic tract; gc, growth cone; SOT, supraoptic tract; TPOC, tract of the postoptic commissure; vcc, ventrocaudal cluster; vrc, ventrorostral cluster. Bar: 50 μm in A, B, D, E; 30 μm in C; 20 μm in F. |
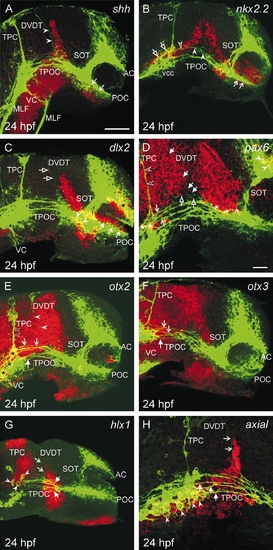
The early axon scaffold exhibits a dynamic spatial relationship with gene expression domains. Confocal laser scanning microscope Z-series images of lateral views of 24-hpf whole-mount zebrafish brains double labelled for the expression of the HNK-1 epitope (green) and (A) shh, (B) nkx2.2, (C) dlx2, (D) pax6, (E) otx2, (F) otx3, (G) hlx1, and (H) axial in red. Rostral is to the right and dorsal is to the top. AC, anterior commissure; DVDT, dorsoventral diencephalic tract; MLF, medial longitudinal fasciculus; POC, postoptic commissure; SOT, supraoptic tract; TPC, tract of the posterior commissure; TPOC, tract of the postoptic commissure; VC, ventral commissure, vcc, ventrocaudal cluster. Bar: 50 μm in A–C, E, F, G; 20 μm in D, H. |
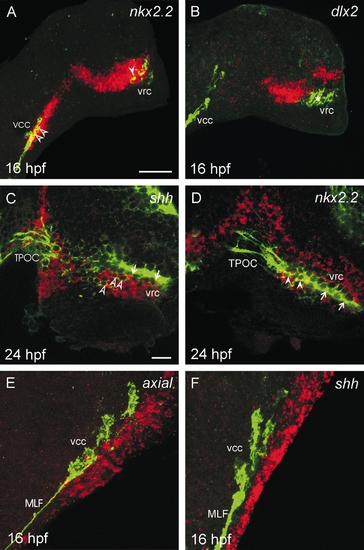
The first neuronal clusters of the zebrafish brain exhibit heterogeneous gene expression patterns. Confocal laser scanning microscope Z-series images (A, B, E, and F) of lateral views of whole-mount zebrafish brains (16 and 24 hpf) double labelled for the expression of the HNK-1 epitope (green) and (A, D) nkx2.2, (B) dlx2, (C, F) shh, and (E) axial in red. (C and D) Single-level scans taken from a Z series. Rostral is to the right and dorsal is to the top. MLF, medial longitudinal fasciculus; TPOC, tract of the postoptic commissure; vcc, ventrocaudal cluster; vrc, ventrorostral cluster. Bar: 50 μm in A, B; 20 μm in C, D, E, F. |
Reprinted from Developmental Biology, 229(2), Hjorth, J.T. and Key, B., Are pioneer axons guided by regulatory gene expression domains in the zebrafish forebrain? High-resolution analysis of the patterning of the zebrafish brain during axon tract formation, 271-286, Copyright (2001) with permission from Elsevier. Full text @ Dev. Biol.