
- Title
-
Clonal behaviour of myogenic precursor cells throughout the vertebrate lifespan
- Authors
- Hughes, S.M., Escaleira, R.C., Wanders, K., Koth, J., Wilkinson, D.G., Xu, Q.
- Source
- Full text @ Biol. Open
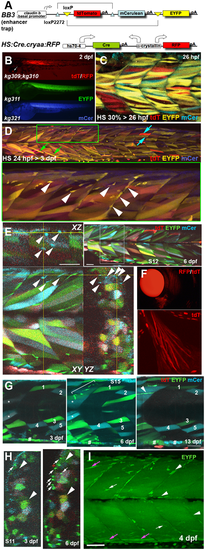
Musclebow2 fish allow genetic marking of muscle fibres and their precursor cells. Transgenic Musclebow2 fish were selected from an enhancer trap screen with larvae at the indicated stages shown in lateral views with anterior to left, dorsal up. (A) The BB3 and HS:Cre.cryaa:RFP DNA constructs used for making transgenic fish. (B) Dissecting scope view of BB3mus7kg309 yielding tdTomato detectable in a subset of muscle fibres from 1?dpf and HS:Cre.cryaa:RFPkg310 yields RFP in lens from 2?dpf (arrow, top). Germline activity of HS:Cre.cryaa:RFPkg310 yielded lines BB3mus7:EYFPkg311 (EYFP, middle) or BB3mus7:mCeruleankg321 (mCer, bottom) expressing throughout muscle tissue. (C) Maximum intensity projection confocal stack (mip) after heat shock at 30% epiboly yielding subsets of fibres expressing one or two recombined and unrecombined alleles, presumably reflecting mosaic Cre action followed by fusion of mpcs expressing BB3mus7 in different recombination states. Note that recombination yielded EYFP fibres more frequently than mCer fibres and that some fibres remain unlabelled. (D) Three-channel confocal mip stack showing BB3mus7 expression at 3?dpf in morphological slow (cyan arrows) and fast (green arrows) fibres and in mncs (arrowheads) in somites. Note the clustered mncs (green box, short stack shown magnified beneath). (E) Single cluster of mCer-marked mncs (arrowheads) in somite 9. Yellow crosshairs indicate planes in XY, YZ and XZ projections. Inset shows location of cluster (white box). Note absence of mCer mncs in rest of plane. (F) BB3mus7 expression in pectoral fin muscles. (G) Time-lapse analysis of short 20?�m stack mips showing the persistent set of marked fibres (numbered) in the deep region of somites 15 and 16 at 3, 6 and 13?dpf. The 6?dpf stack extends further superficially within the myotome than the 3 and 13?dpf stacks. A cluster of mncs (bracket) appears in the deep myotome between 3 and 6?dpf and forms a nascent fibre (arrowhead) by 13?dpf. Note the loss of tdT in dual labelled fibres (asterisks) and the clonal growth of gut-associated cells (hashes). (H) Time-lapse analysis of somite 11 shows maintenance of overall pattern of fibre labelling but changes in colour of some fibres (arrowheads). Note dramatic increase in EYFP-marked superficial mncs (arrows) in this somite which correlates with accumulation of extra EYFP-marked fibres (upper arrowheads). (I) Confocal maximum intensity projection of 4?dpf BB3mus7:EYFPkg311 larva with strong near-uniform signal in myotomal fibres and stronger signal in some mncs on myosepta (arrows) or within the myotome (arrowheads). Note the strongly marked nascent fibres (magenta arrows). Scale bars: 50?�m. |
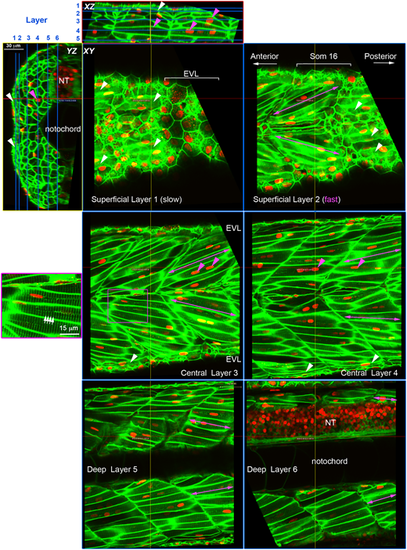
Cell content of the growing zebrafish somite. Larvae expressing membrane-localised EGFP and injected with RNA encoding H2B-mCherry were selected for brightness of both labels and scanned live at high resolution using a sub-Airy pinhole. Three orthogonal views are shown, with blue lines on XZ and YZ projections indicating the six sagittal XY planes. Red and yellow lines indicate the XZ and YZ planes, respectively. Note that EGFP labels the transverse T-tubule system (white arrows) in muscle fibres at regular 2?�m spacing orthogonal to the long axis of the fibre (purple box, magnified at left). Mononucleated fibres parallel to the anteroposterior axis on the surface of the myotome (white arrowheads) are superficial slow fibres. Fast fibres with multiple nuclei (magenta arrowheads) show different orientation depending on the depth within the myotome (magenta arrows); superficially they ?point? anteriorly in the sense that fibres in epaxial and hypaxial myotome project so that their anterior ends are closer to the horizontal myoseptum than their posterior ends (Superficial Layer 2 and Central Layer 3). In the medial myotome, by contrast, fibres have the converse orientation, so that epaxial and hypaxial fibres ?point? posteriorly (Deep Layer 5 and 6). NT, neural tube. |
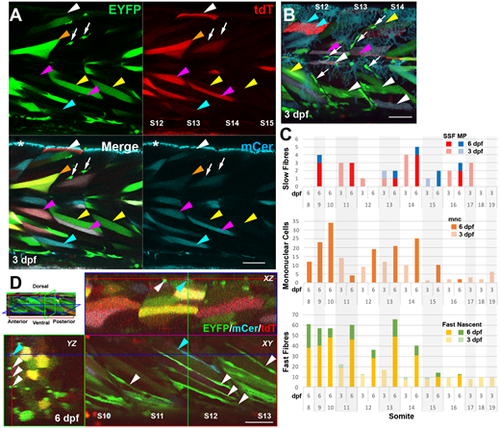
BB3mus7 recombination reveals dynamics of mpc clones. Live confocal microscopy of BB3mus7kg309/+; HS:Cre.cryaa:RFPkg310/+ embryos after heat-shock at 24?hpf. (A) Three-channel confocal slice showing BB3mus7 expression in somites 12-15 at 3 dpf in morphological slow (white arrowheads) and fast (other arrowheads) fibres and in mncs (white arrows) in somites. Note the clustered mncs. Examples of individual fibres marked by tdT-only (white arrowheads), EYFP-only (yellow arrowheads), mCer-only (cyan arrowheads), EFYP and tdT (orange arrowheads) and mCer and tdT (magenta arrowheads). Asterisk indicates autofluorescence from xanthophores in the mCer channel. Faint breakthrough of bright EYFP signal into the mCer detection channel that can be seen, for example, in the mncs and the fibre indicated by the orange arrowhead is readily distinguished from genuine mCer. (B) Short stack (22?�m) mip of somites 12-14 at 3 dpf showing recombined mncs (arrows), superficial slow fibres (white arrowheads), muscle pioneers (magenta arrowheads), fast fibres (yellow arrowheads) and unrecombined slow fibres (cyan arrowheads). Note that some fibres contain both tdT and mCer or EYFP proteins, indicating perdurance of tdT after Cre-driven recombination. (C) Quantification of numbers of marked cells in individual somites of a single fish at 3 and 6 dpf, determined from high-resolution confocal stacks. Only somites 11-16 were scored at both timepoints. SSF, superficial slow fibre; MP, muscle pioneer slow fibre; mnc, mononuclear non-fibre cell; Fast, fast fibre with T-tubules; Nascent, thin nascent fibre spanning anteroposterior extent of somite. (D) XYZ slice projections (indicated on mip at top left) of somites 10-13 at 6 dpf showing reduction in mncs and increase in elongated cells spanning the myotome marked with EYFP (white arrowheads) or mCer (blue arrowheads) within the hypaxial myotome. Coloured crosshairs indicate the plane of the orthogonal boxed optical sections. Scale bars: 50?�m. |
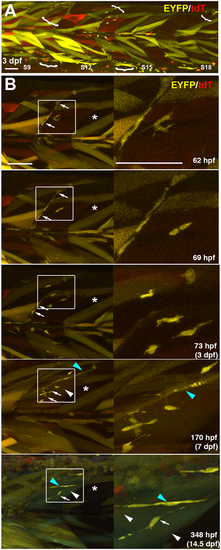
Kinetics of proliferation and differentiation of an EYFP-marked mnc cluster. Time-lapse series taken from full-somite, three-channel confocal stacks of a single Musclebow2 marked fish after heat-shock at 24?hpf. (A) Full somite stack mip of tile scan of somites 9-18 showing five clusters of EYFP-marked mncs (brackets) at 3?dpf. Note the large areas lacking marked mncs and the more numerous marked fibres in anterior somites. (B) Time-lapse confocal mips showing development of the mnc cluster in somite 14 of panel A. Boxes shown magnified at right. Note the early presence and later absence of EYFP-marked mncs on the vertical myoseptum (arrows), the increase in numbers of marked mncs, nascent fibres (blue arrowheads) and large fibres (white arrowheads) in the body of the myotome and the lack of increase in marked fibres in the adjacent region of somite 15 that also lacked marked mncs (asterisks). Scale bars: 50?�m. |
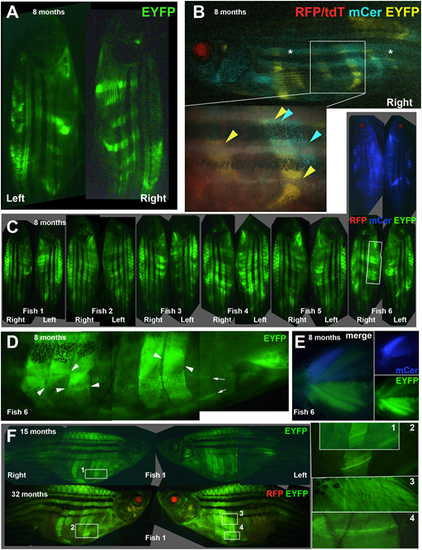
Stable clonal growth of muscle perdures throughout life. (A,B) Single 8-month-old, adult Musclebow2-marked fish that were heat-shocked for 5?min at 37�C at 30% epiboly show distinct patterns of EYFP-marked myotomes on left and right side and between epaxial and hypaxial somite (A). When the right side of the same fish was imaged for all four fluorescent proteins, this fish had faint tdT throughout muscle and RFP in lens, indicating Cre expression, that had triggered clonal marking of several half somites in either EYFP or mCer. Asterisks indicate background blue autofluorescence from xanthophores. Box, magnified in inset, shows regions of hypaxial myotomes 11 and 14 marked by EYFP, whereas a region of somite 15 near the HZM is marked by mCer only. In a similar region of myotome 14, muscle is marked by both mCer and EYFP. (C-E) Eight-month-old adult Musclebow2-marked BB3mus7 siblings (C) that were heat shocked for 5?min at 39�C at 24?hpf. Note the similar size but lower frequency of mCer clones compared to EYFP clones in Fish 6. Boxed region, magnified in D, reveals layers of fibres with distinct orientations (fibre ends indicated by pairs of arrowheads) and individual marked fibres (arrows). Ventral view of pectoral fin region of Fish 6 (E). (F) Fish 1 from C at 15 and 32?months of age showing similar clonal pattern. Numbered boxes are magnified at right. Scale bar: 50?�m. |
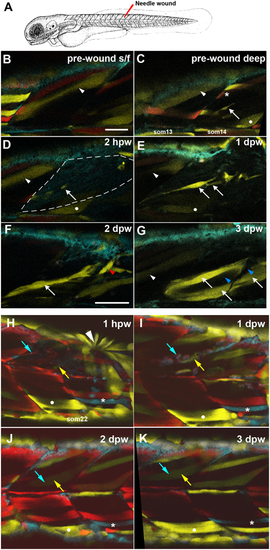
Partial contribution of clones to wound repair in zebrafish muscle. (A) Schematic of wounding procedure (modified from Kimmel et al., 1995). A small needle wound was made near to marked mnc in somite 14 (som14) in the epaxial region of two adjacent somites at 4?dpf (B-G) or epaxial region of som16 at 3?dpf (H-K). Anterior to left, dorsal up. For clarity, short confocal stacks including the marked mnc are shown (B-G) extracted from full somite stacks before (B,C) and after (D-G, H-K) wounding. (B,C) Superficial (B) and deeper (C) images before wounding. Distinct fibres present different colours after limited recombination at an early stage, thereby allowing unambiguous identification of the region (white arrowhead, white dot). A single EYFP-marked mpc (arrow) in som14 identified shortly prior to wounding. Note the presence of red (asterisk) and bright (arrowhead) and dim (dot) yellow fibres. (D) By 2?h post-wounding (hpw), and despite dimming caused by the wounding procedure, the marked mnc (arrow) and the yellow fibres (arrowhead and dot) perdure in the wounded region (outlined by dashed line). In contrast, the red and bright yellow fibres have been lost. (E) At 1-day post-wound (dpw), fluorescent signal has recovered and several bright EYFP-marked cells are detected in the wounded region (arrows). (F) By 2?dpw, EYFP-marked cells are larger and elongating parallel to fibres (arrow) and present in adjacent unwounded somite (red arrowhead). (G) At 3?dpw, the clusters of EYFP-marked mncs are replaced by several EYPF-marked fibres (arrows), indicating the extent of clonal contribution to the regenerate. Note the limited clonal expansion of the EYFP-marked clone over the 3-day period and the absence of label between the marked fibers (blue arrowheads). (H-K) A second example showing single optical slices, with landmarks identifying wounded somites (white dot and asterisk) and tracking repair of a single fibre by fusion of cells from EYFP-marked (yellow arrows) and mCer/marked (cyan arrows) mpcs. Rapid purse-string epidermal wound closure is visible 1?hpw (arrowhead). Scale bars: 50?�m. |