
- Title
-
Functions of SMC2 in the Development of Zebrafish Liver
- Authors
- Li, X., Song, G., Zhao, Y., Ren, J., Li, Q., Cui, Z.
- Source
- Full text @ Biomedicines
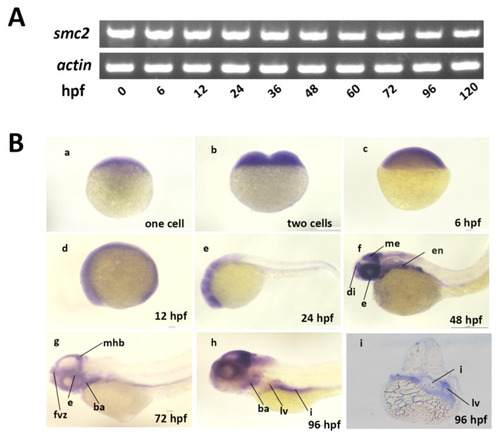
Expression of SMC2 mRNA during zebrafish embryogenesis. (A) Expression levels of SMC2 at different stages were analyzed with RT-PCR and the expression of β-actin served as the control. (B) Detection of SMC2 transcripts during embryogenesis with WISH. hpf, hours post-fertilization; me, mesencephalon; di, diencephalon; fvz, forebrain ventricular zone; ba, branchial arches; mhb, midbrain–hindbrain boundary; i, intestine; en, endoderm; e, eye; lv, liver. |

(A) Top panel: the schematic diagram shows the structure of the target region in the SMC2 gene. Black box, exon; solid line, introns. The bottom panel shows a comparison of the genomic DNA sequences among WT and two mutant alleles, SMC2c504/504 mutants carrying a 31-bp deletion and SMC2c505/505 mutants carrying a 15-bp deletion and 1-bp insertion. The target sequence is indicated in red and underlined. (B) Schematic structures of WT and truncated SMC2 proteins. (C) The relative mRNA levels of SMC2 in WT and homozygous mutants were assayed by qPCR at 4 dpf. The results are expressed as the mean ± SD of three independent experiments (**, p < 0.01; t-test). (D) Lateral views showing the morphology of WT and SMC2−/− mutants at 28, 36, 48 and 72 hpf. (E) Morphology of WT and SMC2−/− embryos injected with or without 200 pg SMC2-mRNAs at indicated stages. The smaller eyes and smaller head were significantly reduced in SMC2-mRNA-injected mutant embryos. The ratios at the bottom right corners indicate the number of embryos with indicated phenotypes vs. total number of observed embryos. |

Loss of SMC2 confers a small liver phenotype. (A) WT and SMC2−/− mutant embryos were stained with RNA probes of fabp10a, a marker of hepatocytes at 72 and 96 hpf. (B) Liver size in SMC2−/− mutants is smaller than that in the WT at 72 and 96 hpf, under the Tg (fabp10a:dsRed; ela3l:EGFP) transgenic background. (C) Livers from WT and SMC2−/− mutants were analyzed with hematoxylin and eosin staining. (D–F) WISH using the exocrine pancreas marker trypsin (D), endocrine pancreas marker insulin (E), and intestinal maker fabp2 (F) as RNA probes. |

SMC2 is required for liver expansion. WT and SMC2−/− mutant embryos were analyzed with markers for liver specification and liver bud expansion at 30, 34 and 48 hpf. WISH probes used include pan-endodermal markers gata4, foxa1, foxa3, and hepatic markers prox1 and hhex. Black arrowhead: liver. |

Hepatocellular apoptosis increased in SMC2−/− mutants. (A) TUNEL analysis of apoptotic cells in the liver of WT and homozygous mutants under the Tg (fabp10a:dsRed; ela3l: EGFP) transgenic background at 96 hpf. Scale bar, 50 μm. (B) Quantitative analysis of the apoptotic cells in the liver. Fluorescence intensities of three WT and three mutant embryos across the liver were determined using the ImageJ software. **, p < 0.01. (C) Frozen sections were stained with EdU staining buffer and nuclei counterstained with DAPI (blue) under the Tg (fabp10a:dsRed; ela3l: EGFP) transgenic background at 96 hpf. Scale bar, 50 μm. (D) The proportions of EdU-positive cells vs. DAPI-positive cells in the liver of three WT and three SMC2 mutant embryos were determined using the ImageJ software. **, p < 0.01. (E) The mRNA levels of genes involved in apoptotic pathways were analyzed with qPCR. Expression levels were normalized to WT. The data expressed as mean ± SD were representatives of three independent experiments containing 40 embryos per sample. *, p < 0.01. |
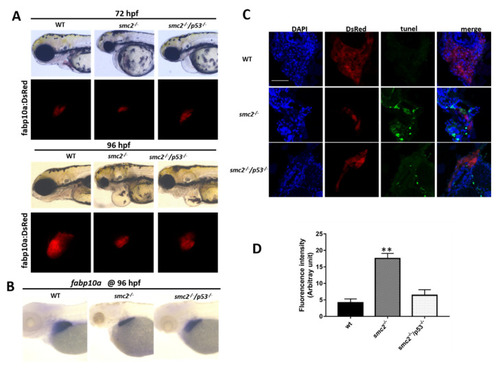
Activation of the p53-dependent apoptotic pathway contributed to the small liver phenotype in SMC2−/− mutants. (A) Phenotype comparison of WT, SMC2−/− and SMC2−/−/p53−/− embryos under the Tg (fabp10a:dsRed;ela3l:EGFP) transgenic background at 72 hpf and 96 hpf. (B) WT embryos, SMC2−/− and SMC2−/−/p53−/− embryos stained with the fabp10a probe at 96 hpf. (C) TUNEL analysis of apoptotic cells in the liver of SMC2−/−/p53−/− mutants compared to WT and SMC2−/− mutants at 96 hpf under the Tg (fabp10a:dsRed;ela3l:EGFP) transgenic background. Scale bar, 50 μm. (D) Quantitative analysis of the apoptotic cells in the liver. Fluorescence intensities of three WT embryos, three SMC2−/− mutant embryos and three SMC2−/−/p53−/− embryo across the liver were determined using the ImageJ software. **, p < 0.01. |

Extensive apoptosis occurring in liver of SMC2−/− mutants is attributable to DNA damage. (A) FACS analyses after DAPI staining of dissociated cells at 96 hpf from wild-type and SMC2−/− embryos. The SMC2−/− embryos have an accumulation of cells in the G2/M phase and more debris. (B) Frozen sections were stained with DAPI to visualize nuclei under the Tg (fabp10a:dsRed; ela3l:EGFP) transgenic background at 96 hpf. The SMC2−/− embryos have an increased number of cells with bigger nucleus compared with WT. Figure 7(B3,B6) are enlargement of the framed part in Figure 7(B2,B5), respectively. *, bigger nuclei. (C) Quantitative analysis of the cell numbers with big nucleus in the liver. Three WT and three mutant embryos across the liver were determined using the ImageJ software. **, p < 0.01. (D) Expression levels of genes (atm and atr) implicated in DNA damage response pathway were analyzed by qPCR in WT and SMC2−/− mutants at 96 hpf. Expression levels were normalized to WT embryos. Data expressed as mean ± SD were representative of three independent experiments. * p < 0.01. (E) Frozen sections were stained against γ-H2AX antibody, which marks DNA double-stranded breaks and nuclei counterstained with DAPI (blue) under the Tg (fabp10a:dsRed; ela3l:EGFP) transgenic background at 96 hpf. The signal was labeled with white arrowhead. (F) Quantitative analysis of the apoptotic cells in the liver. Fluorescence intensities of three WT and three SMC2−/− mutant across the liver were determined using the ImageJ software. **, p < 0.01. |