FIGURE SUMMARY
Title

Combined genetic and chemical screens indicate protective potential for EGFR inhibition to cardiomyocytes under hypoxia

Authors
Heliste, J., Jokilammi, A., Vaparanta, K., Paatero, I., Elenius, K.
Source
Full text @ Sci. Rep.

ZFIN is incorporating published figure images and captions as part of an ongoing project. Figures from some publications have not yet been curated, or are not available for display because of copyright restrictions.

PHENOTYPE:
Fish:
Condition:
Observed In:
Stage: Protruding-mouth

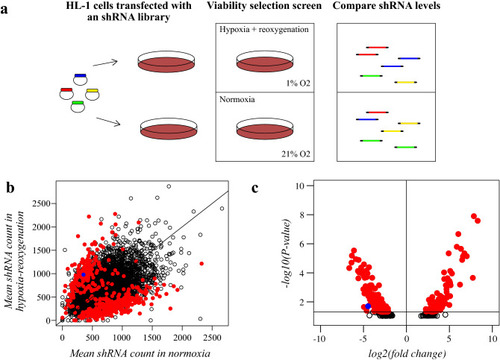
shRNA library screening to identify modulators of cardiomyocyte survival. (a) Schematic overview of the shRNA library screen. HL-1 cells were transduced with a lentiviral shRNA library targeting 4625 genes. Cells were exposed to hypoxia-reoxygenation for a viability dropout screen. As the readout, shRNA abundances were quantified with NGS. (b) Scatter plot illustrating the mean copy number of barcoded shRNAs for each gene after culturing of the cells in normoxia (x-axis) or in hypoxia followed by reoxygenation (y-axis). Significantly regulated genes are depicted with red dots. The dot representing the mean copy number of shRNAs targeting EGFR is indicated in blue. Line depicts the level where shRNA abundances are equal in normoxia and hypoxia-reoxygenation. (c) Volcano plot of log2-transformed fold-changes of mean shRNA counts in normoxic cells and in hypoxia-reoxygenation-treated cells and their respective P values from DESeq2 analysis. Significantly regulated genes are depicted with red dots. The dot representing EGFR is indicated in blue.

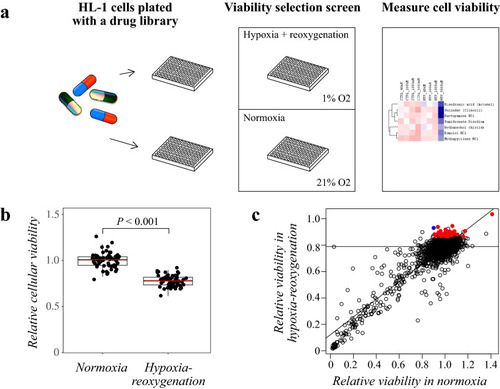
Drug library screening to identify compounds affecting cardiomyocyte viability. Schematic overview of the drug library screen. HL-1 cells were plated with a drug library consisting of 689 FDA-approved compounds. Cells were exposed to hypoxia-reoxygenation for a viability dropout screen. As the readout, cellular viability was measured with CTG assays. (b) Effect of hypoxia-reoxygenation on the viability of DMSO-treated control cells (22% reduction in relative viability (P < 0.001)). (c) Scatter plot of DMSO-normalized relative viability values in normoxia vs. hypoxia-reoxygenation for each drug concentration. Correlation curve depicts the linear model of the correlation of the values between treatments. Horizontal line depicts the average viability of DMSO-treated cells in hypoxia-reoxygenation. Significant viability-improving effects are depicted with red dots for the maximally effective drug concentrations. The dot representing gefitinib is indicated in blue.

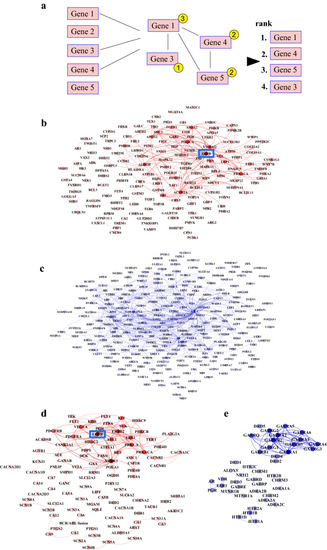
Protein–protein interaction analyses of significant hits from shRNA and drug library screens. (a) Schematic outline of the protein–protein interaction analysis. Significant gene or protein target hits from the screens were selected and number of their mutual interactions were calculated (depicted in yellow circles). Targets were subsequently ranked according to the number of their respective interactions. The lists were generated separately for down- and upregulated targets. (be) Significant hits from the screens were analyzed for their mutual interactions based on experimentally validated protein interaction information. Color of each node is scaled according to the quantity of interactions and color of each line corresponds to the node it originates from. (b) Genes down-regulated by shRNAs enriched by hypoxia-reoxygenation compared to normoxic controls. (c) Genes down-regulated by shRNAs depleted by hypoxia-reoxygenation compared to normoxic controls. (d) Protein targets of antagonistic drugs enhancing survival in hypoxia-reoxygenation. (e) Protein targets of agonistic drugs enhancing survival in hypoxia-reoxygenation. EGFR is highlighted with a blue rectangle.

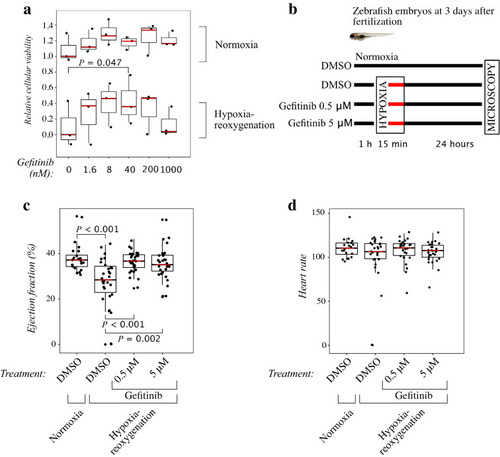
Effects of gefitinib on cardiomyocytes and zebrafish embryos challenged with hypoxia-reoxygenation. (a) Cellular viability of HL-1 cells treated with increasing concentrations of gefitinib. Cells were cultured in normoxia or exposed to 24-h hypoxia followed by 24-h reoxygenation. Cellular viability was measured using CTG assays. N = 3. One-way ANOVA followed by paired T-test and FDR-correction of P values were used for statistical analyses. Data were normalized by setting the median viability of untreated, normoxic controls to one and median viability of hypoxia-reoxygenation treated control samples to zero. (b) Outline of zebrafish embryo experiments. Embryos were treated for 1 h with 0, 0.5 or 5 μM of gefitinib before being exposed to hypoxia for 15 min and reoxygenation for 24 h. (c,d) Ventricular ejection fraction (c) and heart rate (d) of zebrafish embryos exposed to 15 min of hypoxia followed by reoxygenation for 24 h. The embryos were treated with 0, 0.5 or 5 μM of gefitinib. N = 20 for embryos in normoxia, n = 30 for all groups treated with hypoxia-reoxygenation. Kruskal–Wallis test followed by Mann–Whitney U test and subsequent FDR-correction of P values were used for statistical analyses.

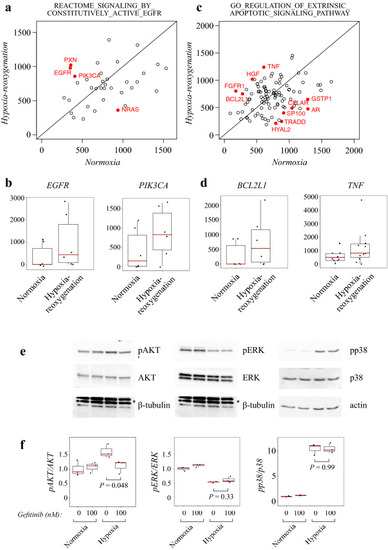
Pathways involved in hypoxia-reoxygenation response and EGFR-mediated signal transduction. (a) Scatterplot of mean reads of shRNAs (normoxia vs. hypoxia-reoxygenation) against genes in the pathway REACTOME_SIGNALING_BY_CONSTITUTIVELY_ACTIVE_EGFR. Significantly differentially expressed genes are depicted with red dots and labels. (b) Boxplots of reads for shRNAs against EGFR and PIK3CA. (c) Scatterplot of mean reads of shRNAs against genes in the pathway GO_REGULATION_OF_EXTRINSIC_APOPTOTIC_SIGNALING_PATHWAY. Significantly differentially expressed genes are depicted with red dots and labels. (d) Boxplots of reads for shRNAs against BCL2L1 and TNF. (e) Western analysis of phosphorylated and total AKT, ERK and p38 in HL-1 cells treated overnight with 0 or 100 nM of gefitinib and exposed to hypoxia for 3 h. β-Tubulin (the lowest band) or actin were used as loading controls, * = non-specific bands. (f) Densitometric analysis of phosphorylated AKT, ERK and p38 against total protein levels (arbitrary units). N = 3 biological replicates. One-way ANOVA followed by paired T-test was used for statistical comparisons.

Acknowledgments
This image is the copyrighted work of the attributed author or publisher, and ZFIN has permission only to display this image to its users. Additional permissions should be obtained from the applicable author or publisher of the image. Full text @ Sci. Rep.