
- Title
-
Disease-Associated Mutations in CEP120 Destabilize the Protein and Impair Ciliogenesis
- Authors
- Joseph, N., Al-Jassar, C., Johnson, C.M., Andreeva, A., Barnabas, D.D., Freund, S.M.V., Gergely, F., van Breugel, M.
- Source
- Full text @ Cell Rep.

The N-Terminal Region of CEP120 Contains Three C2 Domains, the Second of Which Is Targeted by JS (V194A) and JATD (A199P) Mutations (A) Domain organization of human CEP120 protein. cc, coiled-coil domain. C2A,C2B,C2C, first, second, third C2 domain. Shown below are ribbon representations of the corresponding C2 domain structures from (B) Close-up view of the regions of C2B (boxed in A) targeted by the V195A (human V194A) and A200P (human A199P) mutation. Side chains in the vicinity of V195 and A200 are labeled and shown as sticks. (C) Left: ribbon representation of a superposition of the WT (green) and A200P (red) See also |
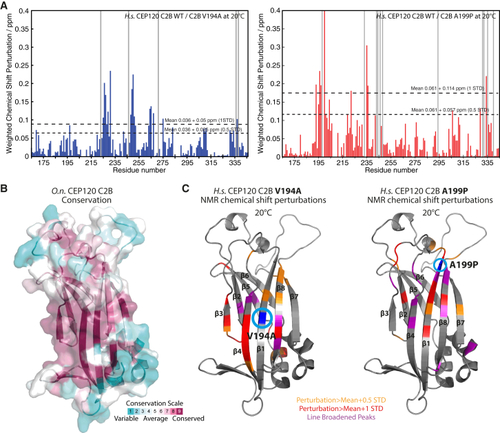
JS (V194A) and JATD (A199P) Mutations in Human CEP120 Cause Subtle Changes in the C2B Domain Structure (A) Per-residue plot of the weighted chemical shift perturbations of the human CEP120 C2B V194A (left) and A199P mutant (right) relative to the WT protein observed in 1H,15N BEST-TROSY NMR spectra at 20°C. Gray bars indicate line-broadened peaks. (B) Molecular surface representation of the (C) Homology model of human CEP120 C2B as ribbon representation. The weighted chemical-shift perturbations of the human CEP120 C2B V194A (left) and A199P mutant (right) relative to the WT protein as observed in (A) are plotted color-coded onto this model. See also |
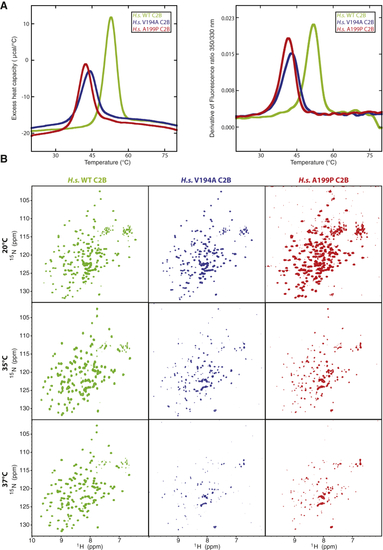
JS (V194A) and JATD (A199P) Mutations in CEP120 Reduce the Thermostability of the C2B Domain (A) Thermal denaturation of human CEP120 C2B domain, WT (green), V194A (blue), and A199P (red) monitored using changes in heat capacity (left panel, DSC) or fluorescence (right panel, thermal scanning fluorimetry). (B) Temperature dependency of NMR data of the human CEP120 C2B domain, WT, V194A, and A199P mutant. 1H,15N BEST-TROSY NMR spectra of 15N-labeled WT (green), V194A (blue), and A199P (red) human CEP120 C2B at 293K (20°C), 308K (35°C), and 310K (37°C). See also |
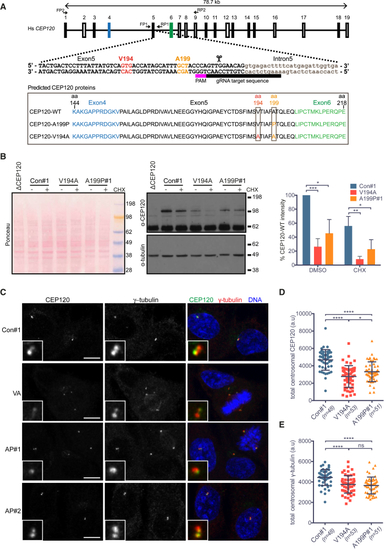
Characterization of RPE-1 Cell Lines Homozygous for the JS (V194A) and JATD (A199P) Mutations in CEP120 (A) Gene structure of human CEP120 with indicated guide RNA used to introduce the V194A or the A199P mutation into this locus. Primers FP1 and RP1 were used to amplify and sequence the targeted genomic region. The framed area depicts protein products corresponding to the sequences obtained from the mutant RPE-1 clones. See (B) The V194A and A199P mutations decrease steady-state levels of CEP120 (C) In V194A and A199P mutant RPE-1 cells, the asymmetric localization pattern of CEP120 is retained, but its overall centrosomal levels are lower than those in control cells. Control (con#1), V194A (VA), and A199P (AP#1) RPE-1 cells stained by antibodies against CEP120 and the PCM protein (γ-tubulin). Images correspond to maximum intensity projections of confocal micrographs. Insets depict high (5×) magnifications of selected centrosomes. Scale bars, 5 μm. (D) Quantification of total centrosomal CEP120 levels from maximum intensity projections obtained in the experiment shown in (C). Total CEP120 fluorescence signal was measured in each cell within a 1.5-μm-diameter circle encompassing the centrosome, followed by subtraction of the corresponding background signal. Swarm plot represents values from single cells with horizontal lines marking the median, and error bars represent SD. p values were obtained from an unpaired, two-tailed Student’s t test (∗p < 0.05, ∗∗∗∗p < 0.0001). Similar results were obtained from three independent experiments. (E) Quantification of total centrosomal γ-tubulin levels from maximum intensity projections obtained in experiment shown in (C). Quantification was performed as in (D). Swarm plot represents values from single cells with horizontal lines marking the median, and error bars represent SD. p values were obtained from a two-tailed Mann-Whitney See also |
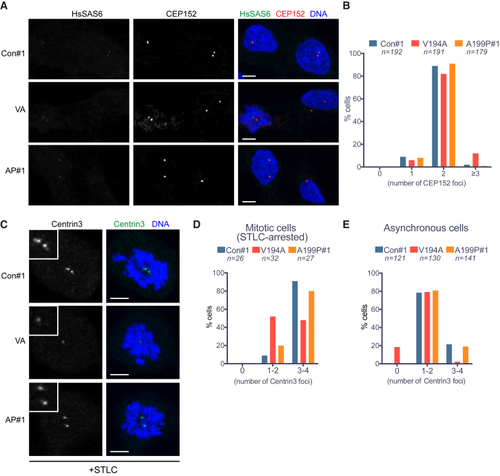
Centriole Numbers Are Preserved in JS (V194A) and JATD (A199P) Mutant RPE-1 Cells (A) CEP152 signal intensity and distribution are comparable among control, V194A, and A199P mutant RPE-1 cell lines. Cells stained by antibodies against the proximal centriole marker CEP152 and the nascent centriole marker HsSAS-6. Images correspond to maximum intensity projections of confocal micrographs of control, V194A, and A199P mutant. Scale bars, 5 μm. (B) The number of CEP152 foci per cell is similar among asynchronous control, V194A, and A199P mutant RPE-1 cell lines. CEP152 localizes to the proximal ends of mother and daughter centrioles, and thus, cells are expected to contain two foci from G1 until centriole disengagement in anaphase. Occasionally, an unfavorable relative orientation, or proximity, prevents resolution of two foci. (C) Centrin-3 signal is weak in mitotic V194A and A199P mutant RPE-1 cells. Cells arrested in mitosis by monopole-inducing STLC treatment stained by antibodies against the distal centriole marker centrin-3. Images correspond to maximum intensity projections of confocal micrographs. Insets depict high (2×) magnification of centrosomes. Scale bars, 5 μm. (D) The number of centrin-3 foci per cell is reduced in mitotic V194A mutant RPE-1 cells. Centrin-3 localizes to the distal part of centrioles, and since centriole duplication yields two centriole pairs, cells in mitosis are expected to contain 4 centrioles. Occasionally, the orientation of centrioles within pairs, their proximity, or the small size of nascent centrioles can preclude resolution of pairs, hence the categories 1–2 and 3–4 on the plot. (E) The number of centrin-3 foci is reduced in asynchronous (non-mitotic) V194A mutant RPE-1 cells with nearly 20% of cells lacking a detectable signal. Asynchronous cells are expected to contain 2–4 centrin-3 foci, depending on their cell-cycle stage. See also |

Impaired Recruitment of Centriole Distal End Proteins in JS (V194A) and JATD (A199P) Mutant RPE-1 Cells (A) CEP164 localizes to the distal end of the mother centriole in control, V194A, and A199P mutant RPE-1 cell lines. Cells were stained by antibodies against CEP164 and γ-tubulin. Images correspond to maximum intensity projections of confocal micrographs. Insets depict high (3×) magnification of centrosomes. Scale bars, 5 μm. (B) The number of CEP164 foci is reduced in V194A cells. Asynchronous (non-mitotic) cells are expected to have a single CEP164 focus from G1 through S phase, followed by the appearance of two foci in G2. (C) Centrosomal CEP164 levels are reduced in both V194A and A199P mutant cell lines. Quantification of total centrosomal CEP164 levels from maximum intensity projections obtained in the experiment shown in (A). Quantification was performed as in (D) TALPID3 localizes to the distal ends of mother and daughter centrioles in control, V194A, and A199P mutant RPE-1 cell lines. Cells stained by antibodies against TALPID3 and γ-tubulin. Images correspond to maximum intensity projections of confocal micrographs. Insets show numbered centrosomes at high (4×) magnification. Scale bars, 5 μm. (E) Centrosomal TALPID3 levels are reduced in both V194A and A199P mutant RPE-1 cell lines. Quantification of total centrosomal TALPID3 levels from maximum intensity projections obtained in the experiment shown in (D). Quantification was performed as in See also |
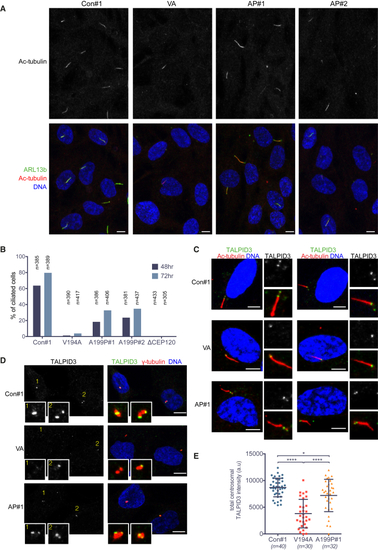
Ciliogenesis Is Markedly Reduced by the JS (V194A) and JATD (A199P) Mutations (A) Cilia numbers are much reduced in V194A and A199P mutant RPE-1 cell lines. Serum-starved (48 hr) RPE-1 cells were stained by antibodies against the ciliary membrane protein ARL13b and acetylated α-tubulin. Images correspond to maximum intensity projections of confocal micrographs. Scale bars, 5 μm. (B) Quantification of the experiment shown in (A). Number of cilia was counted in serum-starved (48 hr or 72 hr) A199P#1, A199P#2, V194A, and CEP120 null (ΔCEP120) RPE-1 cell clones. (C) TALPID3 is detectable in the basal bodies of ciliated V194A, A199P, and control RPE-1 cell lines. Serum-starved (24 hr) RPE-1 cells were stained by antibodies against TALPID3 and acetylated-α-tubulin. Images to the right show basal bodies and cilia at high (2×) magnification. Images correspond to maximum intensity projections of confocal micrographs. Scale bars, 5 μm. (D) TALPID3 localizes to the distal ends of mother and daughter centrioles in control and A199P mutant RPE-1 cell lines, but not in V194A cells. Serum-starved (24 hr) RPE-1 cells were stained by antibodies against TALPID3 and γ-tubulin. Insets show centrosomes at high (4×) magnification. Numbering is included to aid identification of centrosomes. Images correspond to maximum intensity projections of confocal micrographs. Scale bars, 5 μm. (E) Centrosomal TALPID3 levels are reduced in V194A mutant RPE-1 cell lines. Quantification of total centrosomal TALPID3 levels from maximum intensity projections obtained in experiment shown in (D). Quantification was performed as in See also |