- Title
-
Shootins mediate collective cell migration and organogenesis of the zebrafish posterior lateral line system
- Authors
- Urasaki, A., Morishita, S., Naka, K., Uozumi, M., Abe, K., Huang, L., Watase, E., Nakagawa, O., Kawakami, K., Matsui, T., Bessho, Y., Inagaki, N.
- Source
- Full text @ Sci. Rep.
|
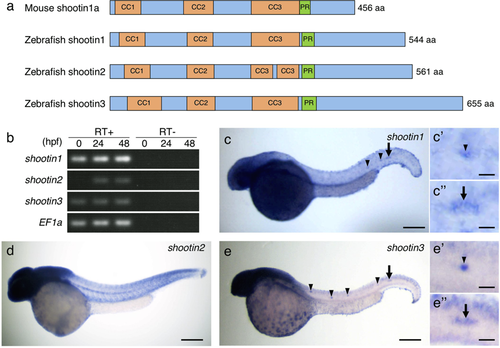
Identification and expression of zebrafish shootin genes. (a) Schematic representation of zebrafish shootin1, shootin2, shootin3 and mouse shootin1 protein structures. The top box for mouse shootin1 indicates the structural domains described previously26, and the bottom three boxes for zebrafish shootin1, shootin2 and shootin3 indicate the corresponding structural domains. CC1-3, coiled-coil domains 1–3; PR: proline-rich domain. (b) RT-PCR analysis of shootin1, shootin2 and shootin3transcripts. Elongation factor 1a (EF1a) was used as a control. Developmental stages are denoted in hours post-fertilization (hpf). RT-PCR products produced in the presence (RT+) or absence (RT−) of reverse transcriptase were electrophoresed using a 3% agarose gel. (c–e) Whole-mount in situ hybridization of shootin1 (c), shootin2 (d) and shootin3 (e) in zebrafish embryos at 36 hpf. Arrowheads and arrows indicate neuromasts and PLLP, respectively. Enlarged images indicate expression of shootin1and shootin3 in the last deposited neuromasts (c’ and e’) and the PLLP (c” and e”). Scale bars: 200 μm for whole body images and 25 μm for enlarged images. |
|
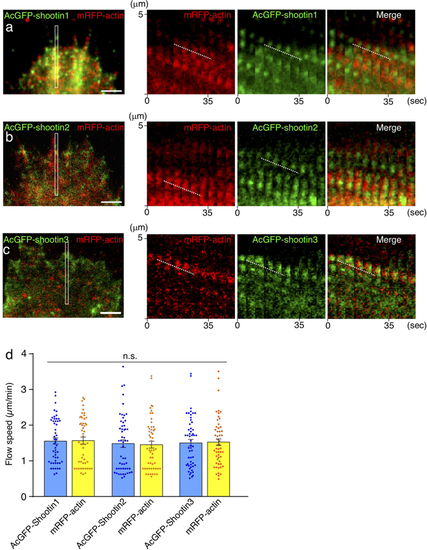
Zebrafish shootin1, shootin2 and shootin3 interact with F-actin retrograde flow. (a–c) Fluorescent speckle images of AcGFP-shootin1 (a), AcGFP-shootin2 (b) and AcGFP-shootin3 (c) with mRFP-actin in XTC fibroblasts (see Movies 1–3). Kymographs (right) of the areas indicated by rectangles in the left panels show that the fluorescent features of AcGFP-shootin and those of mRFP-actin moved at similar speed (dotted lines). (d) Retrograde flow speeds of shootin1 (n = 51 speckles), shootin2 (n = 54 speckles), shootin3 (n = 53 speckles) and F-actin (n = 107 speckles) measured from the kymograph analysis in (a–c). Scale bars: 2 μm. |
|
shootin1 mutants display reduced migration speed of the PLLP. (a) Schematic structures of shootin1 and shootin3 proteins of the shootin1 and shootin3 single mutants. Frameshift mutations in shootin1 and shootin3 resulted in premature stop codons after amino acid positions 47 and 26, respectively. The gray boxes indicate amino acids added by the frameshift mutations; numbers in brackets indicate the numbers of these additional residues. CC1-3: coiled-coil domain; PR: proline-rich domain. (b) Representative time-lapse images of wild-type control, shootin1−/− single mutant, shootin3−/− single mutant and shootin1−/−;shootin3−/− double mutant embryos carrying the SAIGFF213A;UAS:GFP construct. Time-lapse images of a shootin1−/−;shootin3−/−double mutant embryo into which shootin1 and shootin3 mRNAs were injected are also presented at the bottom. Arrows indicate the leading edges of PLLPs. Scale bars: 50 μm. (c) Migration speeds of PLLP in wild-type control (n = 21), shootin1−/− single mutant (n = 26), shootin3−/− single mutant (n = 15) and shootin1−/−;shootin3−/− double mutant (n = 23) embryos at 32–38 hpf obtained from the analyses in (b). (d) Rescue analyses of the PLLP migration in the shootin1;shootin3 double mutants. shootin1 and shootin3 mRNAs were injected into the shootin1−/−;shootin3−/− double knockout (DKO) mutant embryos (DKO + mRNA, n = 25). Data for the uninjected wild-type (WT) and DKO mutant embryos in (d) are shared with those in (c). Data for (c) and (d) represent mean ± SEM. Statistical significance of the differences is indicated with asterisks (***P < 0.01; **P < 0.02; *P < 0.05; ns, nonsignificant).
|
|
shootin1;shootin3 double mutants exhibit reduced number of neuromasts and reduced number of cells in neuromasts. (a) Representative images of wild-type control, shootin1−/− single mutant, shootin3−/− single mutant and shootin1−/−;shootin3−/−double mutant embryos at 48 hpf. An image of a shootin1−/−;shootin3−/− double mutant embryo into which shootin1 and shootin3 mRNAs were injected is also presented at the bottom. Embryos were stained with DAPI. Scale bars: 300 μm. (b) The number of neuromasts obtained from the analyses in (a). The neuromast numbers of wild-type control (n = 15), shootin1−/−single mutant (n = 19), shootin3−/− single mutant (n = 16) and shootin1−/−;shootin3−/− double mutant (n = 20) embryos were counted at 48 hpf. (c) Rescue experiments of the reduced number of neuromasts in the shootin1;shootin3 double mutants. Injected DKO embryos (DKO + mRNA, n = 9) were observed at 48 hpf. Data for the uninjected wild-type (WT) and DKO mutant embryos in (c) are shared with those in (b). (d) Representative images of the DAPI-stained first deposited neuromasts in wild-type control, shootin1−/− single mutant, shootin3−/− single mutant and shootin1−/−;shootin3−/− double mutant embryos at 32 hpf. An image of a neuromast in shootin1−/−;shootin3−/− double mutant embryo into which shootin1 and shootin3 mRNAs were injected is also shown to the right. Dotted lines indicate the areas of neuromasts, in which small nuclei of neuromast cells cluster. Scale bars: 20 μm. (e) The number of cells in the first deposited neuromasts obtained from the analyses in (d). Wild-type control (n = 14), shootin1−/− single mutant (n = 6), shootin3−/− single mutant (n = 11), and shootin1−/−;shootin3−/− double mutant (n = 10) embryos were analyzed at 32 hpf. (f) Rescue experiments of the reduced cell number of the double mutant neuromasts. Injected DKO embryos (DKO + mRNA, n = 12) were observed at 32 hpf. Data for the uninjected wild-type (WT) and DKO mutant embryos in (f) are shared with those in (e). Data in (b,c,e and f) represent mean ± SEM; ***P < 0.01; *P < 0.05; ns, nonsignificant.
|
|
shootin1;shootin3 double mutants exhibit reduced cell number and reduced cell proliferation in the PLLP. (a) Representative images of DAPI-stained PLLP in wild-type control, shootin1−/− single mutant, shootin3−/− single mutant and shootin1−/−;shootin3−/− double mutant embryos at 32 hpf. An image of a PLLP in shootin1−/−;shootin3−/− double mutant embryo into which shootin1 and shootin3 mRNAs were injected is also presented at the bottom. Dotted lines indicate the areas of PLLP, in which small nuclei of PLLP cells cluster. Scale bars: 20 μm. (b) Number of cells in the PLLP of wild-type control (n = 10), shootin1−/− single mutant (n = 6), shootin3−/− single mutant (n = 8) and shootin1−/−;shootin3−/− double mutant (n = 14) embryos at 32 hpf obtained from the analyses in (a). (c) Rescue experiments of the reduced cell number of double mutant PLLP cells. The injected DKO embryos (DKO + mRNA, n = 7) were analyzed at 32 hpf. Data for the uninjected wild-type (WT) and DKO mutant embryos in (c) are shared with those in (b). (d) Representative images of PLLP stained with EdU and DAPI in wild-type control and shootin1−/−; shootin3−/− mutant embryos at 32 hpf. Scale bars: 20 µm. (e) Ratio of EdU-positive cells relative to the total number of cells in the WT (n = 11) and DKO mutant (n = 11) PLLP at 32 hpf obtained from the analyses in (d). Data in (b), (c) and (e) represent mean ± SEM; ***P < 0.01; *P < 0.05; ns, nonsignificant.
PHENOTYPE:
|


