
- Title
-
Single-Cell Transcriptomics Analyses of Neural Stem Cell Heterogeneity and Contextual Plasticity in a Zebrafish Brain Model of Amyloid Toxicity
- Authors
- Cosacak, M.I., Bhattarai, P., Reinhardt, S., Petzold, A., Dahl, A., Zhang, Y., Kizil, C.
- Source
- Full text @ Cell Rep.
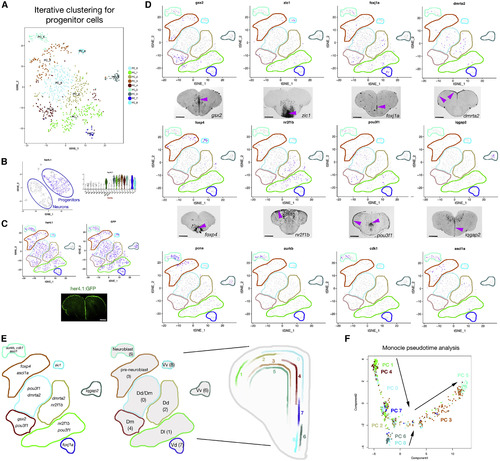
Identification of PC Types (A) tSNE plots for PC clusters. (B) her4.1 expression in a tSNE (left) and violin plot (VLN) of single cell data (right), which contain all cell types. (C) her4.1 expression (left) and GFP expression (right), shown in tSNE plots for PCs. Also shown is her4.1-driven GFP staining on a telencephalon section (bottom). (D) tSNE plots for some of the marker genes and relevant in situ hybridizations. Pink arrowheads denote expression domains. (E) Marker genes and localization of cell types on a representative telencephalic scheme. (F) Cell trajectories on pseudotime generated by monocle2; all colors depict the cell cluster colors in (A). Scale bars, 200 μm. See also Figures S1–S3. |
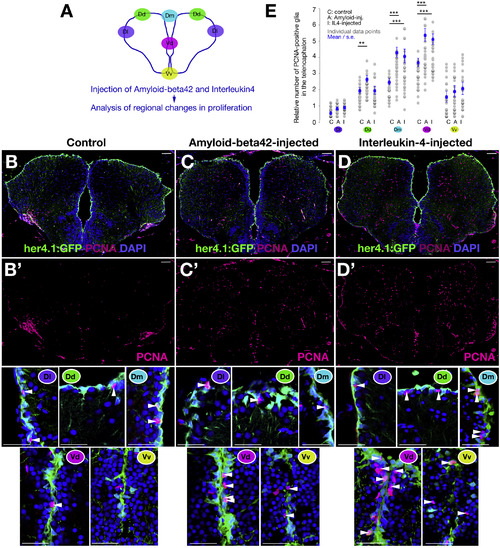
Aβ42 and IL-4 Affect Specific Progenitor Populations in the Adult Zebrafish Brain (A) Schematic view of regionalization in the adult zebrafish telencephalon. (B–D’) Immunohistochemistry (IHC) staining for her4.1-driven GFP and PCNA on control (B), amyloid-injected (C), and IL-4-injected (D) telencephalic sections. In (B’), (C’), and (D’), PCNA channels are shown. Close-up views of GFP and PCNA double IHC are shown below the single channels. Regions are marked with color-codes as in (A). Scale bars, 50 μm. (E) Quantification graph for the relative number of proliferating progenitors. Three brains were used for every experimental group. Data are represented as mean ± SEM. The levels of significance are ∗p < 0.05, ∗∗p < 0.01, and ∗∗∗p < 0.001. |
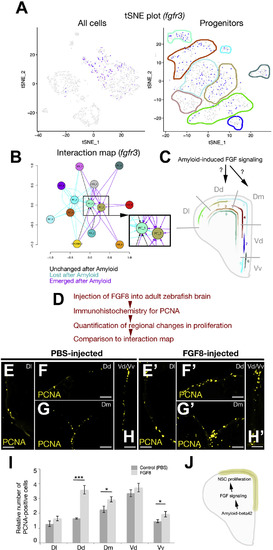
Functional Investigation of Interaction Maps Reveals Fgf Signaling Controlling PC Proliferation (A) tSNE plot (all cells on the left, progenitors on the right) for fgfr3, which is localized specifically to PCs. (B) Predicted interaction map for fgfr3 and its ligands. (C) Based on the interaction prediction, PC 2 and PC 5 are exposed to FGF signaling after amyloid treatment. (D) Methodology for functional validation of the effects of FGF signaling on PC proliferation. (E–H’) Immunohistochemical staining for PCNA in control (E–H) and FGF8-injected (E’–H’) adult zebrafish brains. Regional identities are indicated with the names denoted in (C). Panels E–H modified from Kizil and Brand, 2011. (I) Quantification of regional proliferation response after FGF8-injection. (J) Working model of the regulatory cascade of NSPC proliferation in the adult zebrafish brain by Aβ42-induced FGF signaling. Three sections were quantified for every experimental group. Scale bars, 50 μm. Data are represented as mean ± SEM. The levels of significance are ∗p < 0.05, ∗∗p < 0.01, and ∗∗∗p < 0.001. |