
- Title
-
Identification of human D lactate dehydrogenase deficiency
- Authors
- Monroe, G.R., van Eerde, A.M., Tessadori, F., Duran, K.J., Savelberg, S.M.C., van Alfen, J.C., Terhal, P.A., van der Crabben, S.N., Lichtenbelt, K.D., Fuchs, S.A., Gerrits, J., van Roosmalen, M.J., van Gassen, K.L., van Aalderen, M., Koot, B.G., Oostendorp, M., Duran, M., Visser, G., de Koning, T.J., Calì, F., Bosco, P., Geleijns, K., de Sain-van der Velden, M.G.M., Knoers, N.V., Bakkers, J., Verhoeven-Duif, N.M., van Haaften, G., Jans, J.J.
- Source
- Full text @ Nat. Commun.
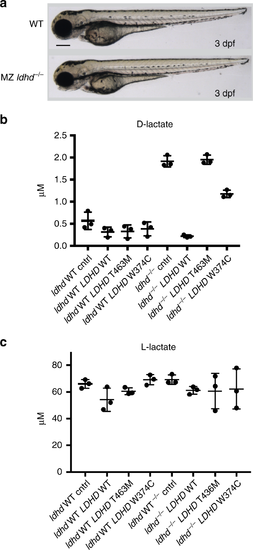
Zebrafish metabolic studies. a Maternal zygotic mutant ldhd−/− zebrafish larvae (3 dpf, lower panel) show no phenotype differences compared to wildtype zebrafish larvae (upper panel). Scale bar: 250 μm. Levels of D-lactate (b) and L-lactate (c) in response to LDHD activity. Wildtype zebrafish larvae (ldhd WT) and ldhd−/− zebrafish (ldhd−/−) at the 1 cell stage were subject to four conditions: uninjected (cntrl), microinjected with human wildtype LDHD RNA (LDHD WT), microinjected with patient variant Thr463Met LDHD RNA (LDHD T463M), or Trp374Cys LDHD RNA (LDHD W374C). Metabolic assays were then performed to detect D-lactate and L-lactate present at 3 dpf. The conditions where LDHD are nonfunctional result in higher levels of D-lactate; in contrast, no effect is seen in the levels of L-lactate. Measurements for each condition were performed on three batches of 10 embryos. Mean and standard deviation shown
PHENOTYPE:
|