
- Title
-
Heterogeneous fates and dynamic rearrangement of regenerative epidermis-derived cells during zebrafish fin regeneration
- Authors
- Shibata, E., Ando, K., Murase, E., Kawakami, A.
- Source
- Full text @ Development
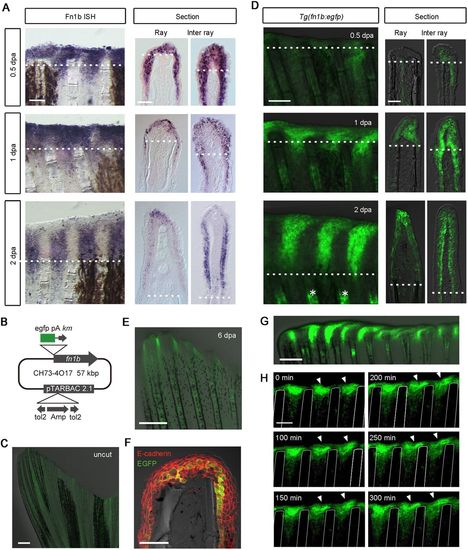
Imaging of RE cells in Tg(fn1b:egfp) during fin regeneration. (A) Whole-mount in situ hybridization analysis of fn1b expression at 0.5, 1 and 2 dpa. Respective sections through the ray or inter-ray regions are shown on the right. fn1b was strongly induced in the RE by 1 dpa, and particularly in the inter-ray epithelium after 2 dpa. The dotted lines indicate the amputation plane. Scale bars: 100 µm (left); 50 µm (right). (B) Map of the BAC construct used to generate the Tg zebrafish. The egfp cassette was inserted by homologous recombination at the initiation site of the fn1b gene in the CH73-4O17 BAC. The tol2 cassette, which carries inverted orientations of the tol2 sequence and the intervening ampicillin resistance gene (Amp), were introduced within the pTARBAC2.1 vector. pA, polyadenylation sequence; km, kanamycin resistance gene. (C) EGFP expression in the Tg fin before amputation. A very low level of EGFP fluorescence was observed throughout the uncut fin. Scale bar: 500 µm. (D) EGFP expression in the Tg fin (left panels) after amputation and their respective sections. The respective sections through the ray or inter-ray regions are shown on the right. The dotted line indicates the amputation plane. Scale bars: 100 µm (left); 50 µm (right). The asterisks show EGFP expression in the fin ray mesenchyme. (E) EGFP expression at 6 dpa. EGFP expression decreased after 2 dpa, and became weak at 6 dpa. Scale bar: 500 µm. (F) Immunohistochemical detection of E-cadherin (red) and EGFP (green) in a fin section of Tg(fn1b:egfp) at 1 dpa. Scale bar: 50 µm. (G) Whole-mount image of the regenerating Tg fin at 2 dpa. Scale bars: 200 µm. It appears that EGFP+ cells are recruited from the inter-ray regions and move laterally to cover the ray regions. For A,C-G, n>5 fins (A) or sections (C-G). (H) Time-lapse analysis of EGFP+ cells in the Tg(fn1b:egfp). Images were captured every 5 min from 24 to 29 hpa (n=3 fins). Only the images at 0, 100, 150, 200, 250 and 300 min are shown. The arrowheads indicate representative EGFP+ cells that may migrate from the inter-ray to the ray region. The white lines indicate the outlines of the fin rays. Scale bar: 100 µm. |
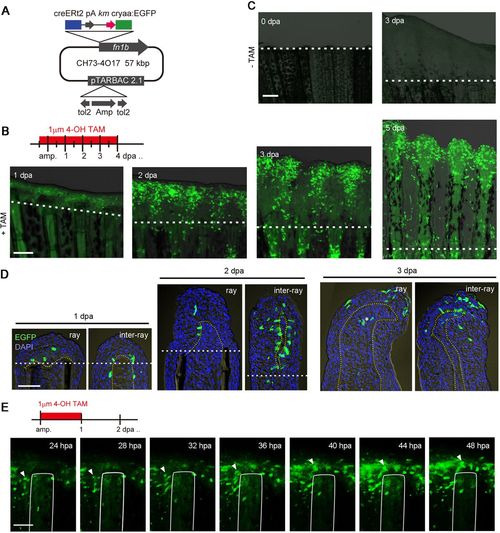
Tracking cell fates of the RE using Tg(fn1b:creERt2). (A) Map of the BAC construct used to generate Tg(fn1b:creERt2). The creERt2 cassette was inserted in place of the egfp cassette at the site of the fn1b gene in the CH73-4O17 BAC. cryaa, crystalline alpha a promoter. (B) Labelling of fn1b-expressing cells by Cre-loxP recombination in the double Tg(fn1b:creERt2;Olactb:loxP-dsred2-loxP-egfp). The Tg was treated with 1 µM 4-OH TAM from 12 h before amputation until 4 dpa. The dotted lines indicate the amputation planes. Scale bar: 200 µm. (C) Absence of EGFP+ cells in the double Tg fin in the absence of 4-OH TAM treatment. Scale bar: 200 µm. (D) Longitudinal tissue sections of Cre-labelled fins at 1, 2 and 3 dpa, labelled as in B. The dotted lines indicate the amputation planes. Scale bar: 50 µm. For B-D, n>5 fins (B,C) or sections (D). The sections were counterstained with DAPI (blue). (E) Time-lapse analysis of Cre-labelled EGFP+ cells from 24 hpa until 48 hpa. Images were captured every 1 h (n=3 fins). Only the images at 24, 28, 32, 36, 40, 44 and 48 hpa are shown. The arrowheads indicate a representative tracking of the same cell over time, indicating that the labelled cell indeed migrated from the inter-ray region to the ray region. The white lines show the outline of the fin ray bone. Scale bar: 100 µm. |
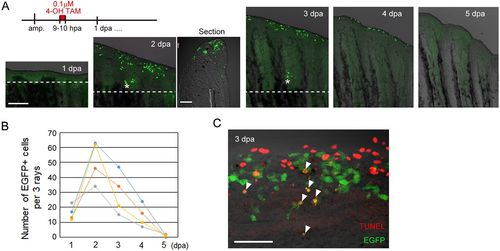
Early RE cells are disposed of by apoptosis by 5 dpa during zebrafish fin regeneration. (A) Tracking of early RE cells that were pulse-labelled at 9-10 dpa with 0.1 µM 4-OH TAM. The labelled cells moved distally and disappeared by 5 dpa. The longitudinal section of the 2 dpa fin shows that the EGFP+ cells localize to the tip of the wound epidermis. The dotted lines indicate the amputation planes. Scale bars: 200 µm (fins) and 50 µm (section). (B) Quantification of the number of EGFP+ cells in A. EGFP+ cells in three adjacent rays were counted (n=4 zebrafish). (C) Detection of the TUNEL+ cells (red) and EGFP+ cells derived from the early RE cells that were labelled by Cre-loxP recombination at 9-10 hpa. The arrowheads show the TUNEL+ and EGFP+ cells. Scale bar: 50 µm. |
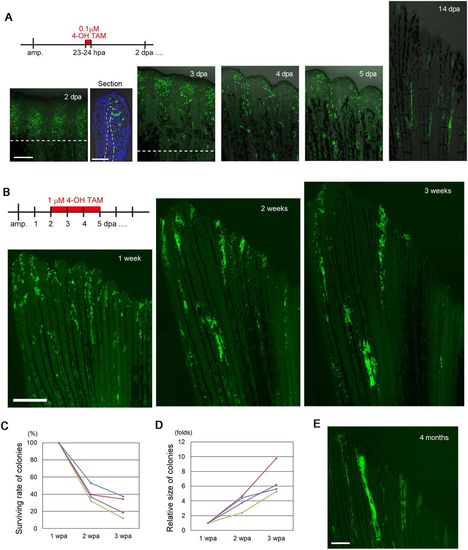
Later emerging RE cells contribute to the regenerated epidermis. (A) Tracking of the progeny of fn1b-expressed RE cells that were labelled by Cre-loxP recombination at 23-24 hpa in the Tg(fn1b:creERt2;Olactb:loxP-dsred2-loxP-egfp). A longitudinal section of the 2 dpa fin shows that EGFP+ cells are found in both basal and non-basal cells in the RE. The section was counterstained with DAPI. The dotted line indicates the amputation plane. Scale bars: 200 µm (fins) and 50 µm (section). (B) Tracking of the progeny of RE cells that were labelled by Cre-loxP recombination at 2-5 dpa. Cell colonies derived from the Cre-labelled cells were evident at 1 wpa; however, whereas the size of the colonies grew over time, the number of colonies decreased. (C) Quantification of the number of colonies derived from the Cre-labelled cells in B at 1, 2 and 3 wpa (n=4 zebrafish). Approximately 80% of the colonies disappeared between weeks 1 and 3. Each line in the graph corresponds to an individual fish. (D) Quantification of the size of colonies derived from the Cre-labelled cells in B at 1, 2 and 3 wpa (n=4 zebrafish). In contrast to the number of colonies, the colony size increased between 1 and 3 weeks. Each line in the graph corresponds to an individual fish. (E) Tracking of the Cre-labelled RE-derived cells after 4 months. Progeny of the RE-derived cells were still retained in the epidermis, although their number was decreased relative to the number at 3 wpa. Scale bar: 500 µm. |
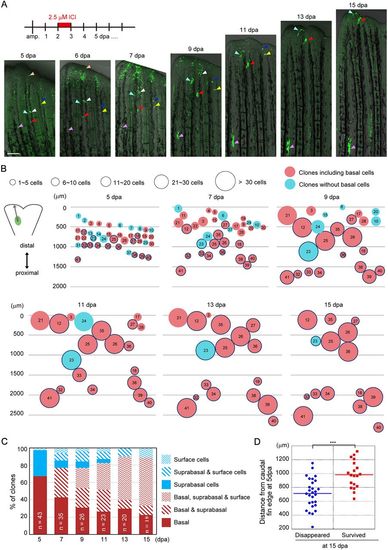
Fate analysis of single fn1b-expressed RE cells. (A) Single clone tracking of the progeny of fn1b-expressed RE cells labelled by Cre-loxP recombination in the Tg(fn1b:creERt2;Olactb:loxP-dsred2-loxP-egfp). Labelling was performed using 2.5 µM ICI at 2-3 dpa. The coloured arrowheads indicate the respective positions of representative clones. Scale bar: 200 µm. The position of the purple arrowheads relative to the amputation site is approximately constant. Clones of the Cre-labelled cells gradually move in the caudal direction and disappear at the fin edge. (B) Schematic illustration of the data from the single-clone tracking analysis. Distances of clones from the caudal edge, sizes of the clones and inclusion of basal cells are schematically expressed by the positions, sizes and colours of the respective circles. n=41 clones from 10 zebrafish. Many of the clones without basal cells and/or located in distal regions disappeared by 15 dpa. An increase in cell number does not depend on the position of the clones, but rather occurs at random. The thick blue outline of the circles indicates the clones that survived beyond 15 dpa. (C) Ratios of individual epidermal clone types grouped by cell type composition. The ratios are expressed as percentage of cells among the surviving clones at each stage. At 5 dpa, most clones derived from the RE contained only basal or suprabasal cells. The suprabasal clones produced the surface cells and finally became the clones containing only surface cells at 15 dpa, whereas the basal clones produced the suprabasal and surface cells to become clones containing all three cell types. (D) Beeswarm plot of the respective positions of clones from the caudal fin tip at 5 dpa. The surviving clones at 15 dpa were originally located in the proximal regions at 5 dpa, whereas a significant number of distally located clones at 5 dpa disappeared at 15 dpa (***P=0.0000418). n=19 (surviving clones) and 29 (disappearing clones). Student's t-test (two-tailed) was performed to assess statistical significance. Every result is plotted; horizontal bars indicate the mean. |
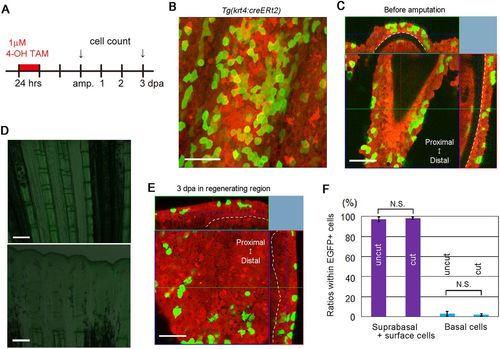
Fate analysis of suprabasal and surface epidermal cells. (A) Experimental procedure used to conduct the fate analysis of surface and suprabasal cells. (B) A representative z-stack image of an uncut fin from a Tg(krt4:creERt2;Olactb:loxP-dsred2-loxP-egfp) in which the non-basal epidermal cells were labelled by treatment with TAM. Scale bar: 50 µm. A number of Cre-labelled cells are seen 2 days after TAM treatment. (C) A confocal optical section of the Tg fin shown in B. The dotted lines indicate the basement membranes of the epidermis. The top and right images are tomographic images reconstituted from the z-stack data. The Cre-labelled cells are mostly seen in the suprabasal and surface cell layers. Scale bar: 50 µm. (D) Cre-mediated recombination without TAM treatment in an uncut fin (top) and a regenerating fin (bottom) at 3 dpa from Tg(krt4:creERt2;Olactb:loxP-dsred2-loxP-egfp). EGFP+ cells were not observed (n=3 for both groups). Scale bars: 200 µm. (E) A confocal optical section of a 3 dpa fin from Tg(krt4:creERt2) that was amputated 2 days after TAM treatment. The top and right images are tomographic images reconstituted from the z-stack data. The dotted lines indicate the basement membranes of the epidermis. The progeny of the Cre-labelled non-basal cells localized to the suprabasal and surface cell layers. Scale bar: 50 µm. (F) Quantification of the ratios of respective epidermal cell types within Cre-labelled EGFP+ cells, before and after fin amputation. Although only a small fraction of labelled cells was seen in the basal epidermal layer, the ratio of basal cells within EGFP+ cells did not change, comparing before and after amputation, suggesting that most of the suprabasal and/or surface cells maintained their identities and did not de-differentiate into the basal cells during regeneration. Data are mean±s.e.m.; Student's t-test (two-tailed) was performed to assess statistical significance (n=27 images from eight uncut fins and 28 images from eight regenerating fins, respectively). N.S., not significant (P=0.69). |
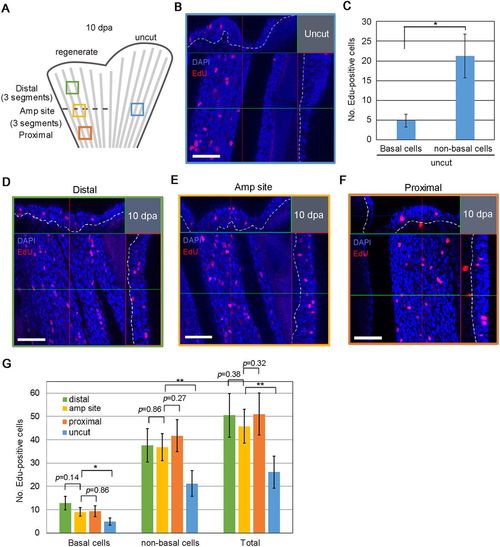
Global cell proliferation replenishes epidermal cells. (A) Schematic diagram showing the process used for quantification of EdU+ epidermal cells. The dorsal half of the fin was amputated at the middle of the central fin ray. The numbers of EdU+ cells were scored in four fin areas of a 10 dpa fin (212×212 µm); the central region at the level of the amputation site (Amp site, yellow box), the distal region (three segments distal to the amputation site; Distal, green box), the proximal region (three segments proximal to the amputation site; Proximal, orange box), and the uncut region at the level of amputated site (blue box). As the number of EdU+ cells were nearly the same in the proximal and distal parts of the uncut fin region, scoring was carried out in the central region at the site of amputation. (B) Detection of EdU+ cells in the epidermis using confocal optical sections in the uncut region (blue box in A). Confocal longitudinal and transverse optical sections are shown at the top and on the right, respectively. The vertical and horizontal red and green lines indicate the approximate sites of the optical sections. Nuclei were counterstained with DAPI. The white dotted lines show the boundary of the epidermis and mesenchyme. Scale bar: 50 µm. (C) Quantification of the number of EdU+ cells in B. The number of cells were counted on confocal images (n=10 images from 5 zebrafish). Data are mean±s.e.m.; Student's t-test (two-tailed) was performed to assess statistical significance. *P<0.05. (D-F) Detection of EdU+ cells in the epidermis using confocal optical sections in the distal region (D, green box in A), the central region (E, yellow box in A) and the proximal region (F, orange box in A). Nuclei were counterstained with DAPI. White dotted lines indicate the boundaries between epidermis and mesenchyme. Scale bars: 50 µm. (G) Quantification of the number of EdU+ cells in D-F and comparison with those in uncut fin in C. The respective colours of the bars represent the regions shown in A. The number of cells was counted on confocal images (n=10 images from different areas of five zebrafish). Data are mean±s.e.m.; Student's t-test (two-tailed) was performed to assess statistical significance. *P<0.05; **P<0.005. |
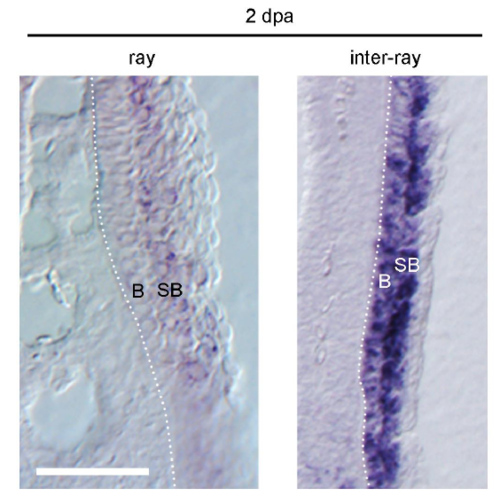
fn1b expression in the ray and inter-ray regions of the RE. The close-up view of fn1b expression at 2 days post amputation (dpa) in the ray and inter-ray regions, respectively. The expression is detected in the suprabasal cells (SB) of the RE and basal cells (B) of the inter-ray RE, but not of the ray region. The dotted lines indicate the boundaries between the epidermis and mesenchyme. Scale bar, 50 m. |
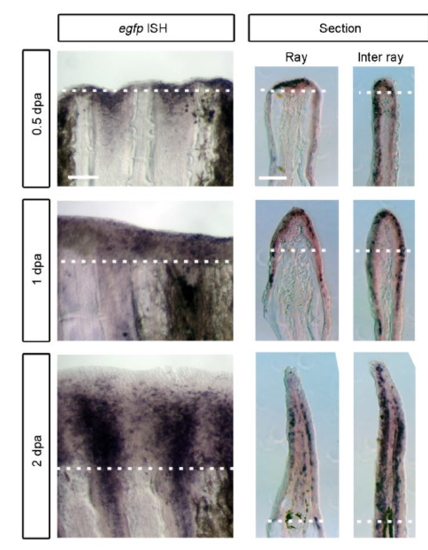
egfp mRNA expression in the Tg(fn1b:egfp). Whole mount ISH analysis of the egfp expression in the Tg(fn1b:egfp) at 0.5, 1 and 2 dpa. Respective sections through the ray and inter-ray regions are shown on the respective right side. The dotted lines indicate the amputation plane. The expression is nearly the same with that of endogenous fn1b shown in Fig. 1A. Scale bars, 100 m (whole-mounts) and 50 m (sections). |
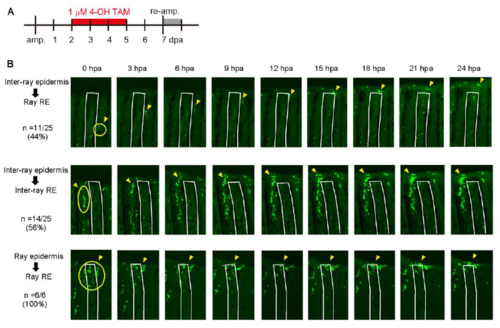
Early process of the RE formation before 24 hpa. (A) Experimental procedure for the fate analysis of epidermal cells that were pre-labelled by the Cre-loxP recombination in the Tg(fn1b:creERt2;Olactb:loxP-dsred2-loxP-egfp). The fn1b+ RE cells were labelled between 2 to 5 dpa. At 7 dpa, their fins were re-amputated and observed every 3 hrs until 24 hpa. (B) Representative fates of pre-labelled epidermal cells that locate in the inter-ray region (top and middle) and the ray region (bottom), respectively. Clusters of EGFP+ cells were chosen and tracked their fates. The inter-ray epidermal cells either migrated to become the ray RE (top) or kept staying in the inter-ray region (middle). All of the ray epidermal cells did not migrate laterally, contributing to the ray RE. |

Fate tracking of a single clone. (A) Whole mount images of a representative clone (white arrowheads) at 5, 7, and 9 dpa. Scale bar, 100 m. (B) Confocal images of the same clone (No. 11) at respective stages. The top and right images are tomographic images reconstituted from the z-stack data. The dotted lines show the boundary between epidermal cells and mesenchymal cells. The clone contained only basal cells at 5 dpa, but produced suprabasal and surface cells at later stages. Scale bar, 50 m. (C) Confocal optical sections of the same clone (No. 11) focusing on the surface cells within the same region of the epidermis. Respective pictures show the same area and in the same direction with those in (B). Scale bar, 50 m. |
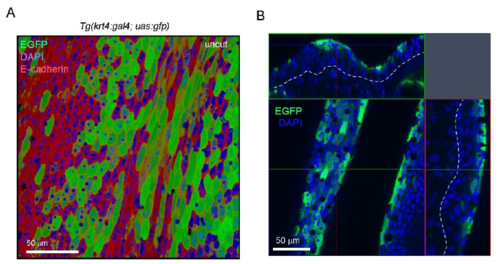
Expression of EGFP in an uncut fin from a Tg(krt4:gal4; uas:gfp). (A) Immunohistochemical detection of E-cadherin (red) and EGFP (green) in an uncut fin from a Tg(krt4:gal4; uas:gfp). The nuclei were counterstained with DAPI (blue). Scale bar, 50 m. (B) Confocal image of the Tg(krt4:gal4; uas:gfp) fin shown in (A). Top and right images are the tomographic images reconstituted from the z-stack data. The white dotted lines indicates the boundary between the epidermis and the mesenchyme. EGFP+ cells are mostly localised in the suprabasal and surface epidermal layers. Scale bar, 50 m. |