
- Title
-
Three-dimensional live multi-label light-sheet imaging with synchronous excitation-multiplexed structured illumination
- Authors
- Xu, D., Zhou, W., Peng, L.
- Source
- Full text @ Opt. Express
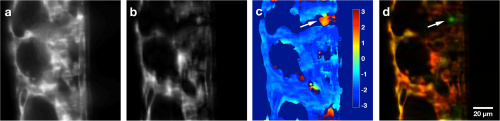
Spectral-SIM processing of dual excitation-channel (488 nm and 561 nm) image. Raw images were taken from a caudal trunk of Tg(kdrl:GFP; fli1a:Gal4; UAS:nfsB-mCherry) triple transgenic fish (ventral right, dorsal left). GFP and mCherry were co-expressed in vascular endothelial cells. The SIM pattern period was 14 μm. 11 step exposures were used. Scale bar: 20 μm. (a) Reconstructed zero-order component image, IFFT [R̃′0(kx, ky)]. contains both in-focus ballistic signals and out-of-focus and scattered signals. (b) The absolute value of the complex image, IFFT [R̃′1(kx, ky)], is background free. (c) The phase value of the complex image, IFFT [R̃′1(kx, ky)], encodes the sources of excitation. The arrow points to an area with a phase different from the majority of the map. (d) The dual excitation image represented in pseudo colors (green: emission from 488 nm laser, mainly emitted by GFP; red: emission from 561 nm laser, mainly emitted by mCherry). The image was obtained by spectral decoding Rn(x, y). The same area pointed by the arrow has stronger 488nm excitation (stronger GFP expression) than the rest of the image. |
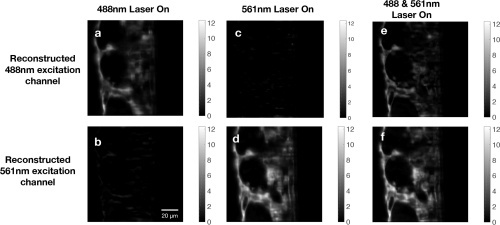
Reconstructed dual-excitation-channel images taken with one laser off. Results show negligible channel bleedthrough. Scale bar: 20 μm. |
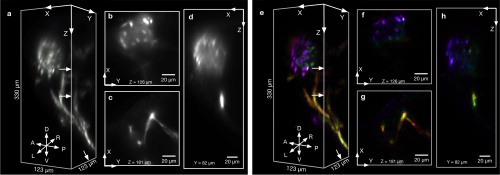
3D triple excitation channel imaging of live Tg(kdrl:GFP; fli1a:Gal4; UAS:nfsB-mCherry) embryo stained by Syto60 at 2dpf. 3D Rendered spectral-SIM image and slice fly-through movie can be viewed in Visualization 1 and Visualization 2. The SIM pattern period was 14 μm. 11 step exposures were used. Scale bar: 20 μm. (a) 3D rendered mono-channel image taken with a plane illumination. Arrows mark cross section locations. (b) Cross section at 126 μm deep, showing a strong background that blurs fine structures. (c) Cross section of vasculature at 181 μm deep. (d) Lateral cross section. (e) 3D rendered triple-excitation-channel image taken with spectral-SIM. The image is free of diffused background. Blue: 640 nm excitation, mostly emitted by Syto60. Green: 488 nm excitation, mostly emitted by GFP emission. Red: 561 excitation, mostly emitted by mCherry. (f) Cross section of 3D spectral-SIM image at 126 μm deep, showing Syto60 stained nasal epithelium cells can be excited by both 561 nm and 640 nm laser lines. The image is free of diffused background. (g) Cross section of vasculature, captured by spectral-SIM at 181 μm deep, showing co-expressed GFP and mCherry, excited by 488 and 561 nm respectively. (h) Lateral cross section of 3D spectral-SIM image. |