
- Title
-
3D MALDI Mass Spectrometry Imaging of a Single Cell: Spatial Mapping of Lipids in the Embryonic Development of Zebrafish
- Authors
- Dueñas, M.E., Essner, J.J., Lee, Y.J.
- Source
- Full text @ Sci. Rep.
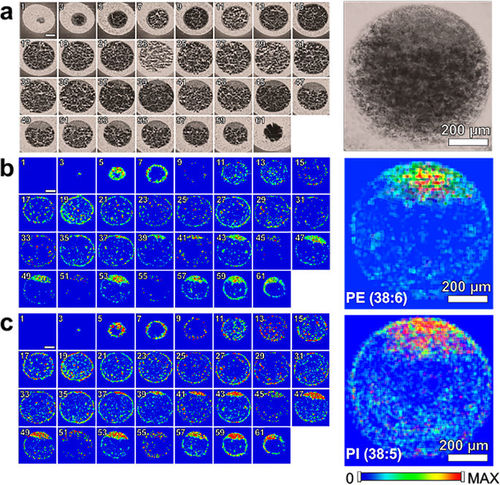
(a) Odd numbered optical images of fertilized zebrafish embryo at the one-cell stage. False color two-dimensional MALDI-MS images of (b) PE (22:6_16:0) at m/z 762.509 and (c) PI (18:0_20:5) at m/z 883.535. Projected images are shown on the right by overlaying all 2D images. All species were detected as deprotonated, [M-H]−. |

(a) Even numbered optical images of fertilized zebrafish embryo at the 1-cell stage. False color two-dimensional MALDI-MS images of (b) PC (18:1_16:0) at m/z 798.535 and (c) PC (16:0_22:6) at m/z 844.525. Projected images are shown on the right by overlaying all 2D images. All species were detected as potassiated, [M + K]+. |
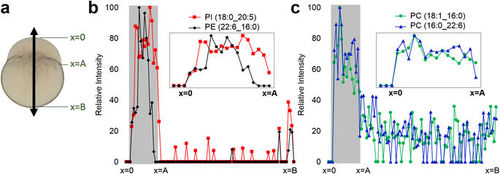
(a) Optical image of fertilized zebrafish embryo showing the arrow to indicate where the line profile is obtained. Line profile of ion intensities for (b) PI (18:0_20:5) and PE (22:6_16:0) and (c) PC (18:1_16:0) and PC (16:0_22:6), obtained from the tissue section 53 and 52, respectively. |
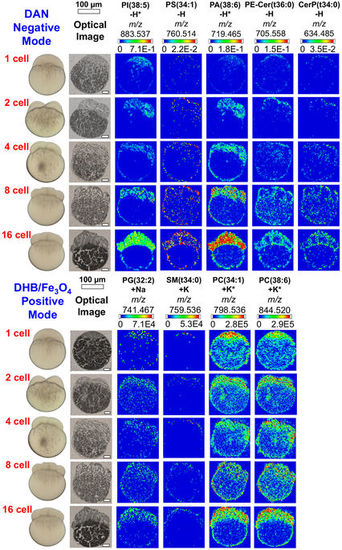
MALDI-MS images of selected lipid species in early developmental stages of zebrafish embryos. Peak assignments were based on accurate masses, except those marked by asterisk which were confirmed by MS/MS. |
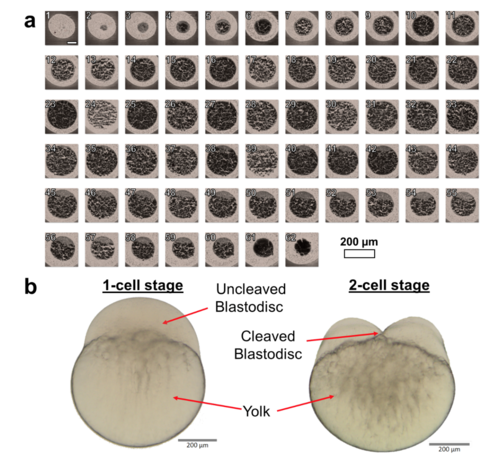
(a) Bright-field images of serial cryo-sections of entire fertilized zebrafish embryo (Danio rerio) at the one-cell stage. The order of the sections is notated at the top left hand corner of each image. (b) Bright-field images of intact zebrafish embryos with the blastodisc, cleavage and yolk labeled. |
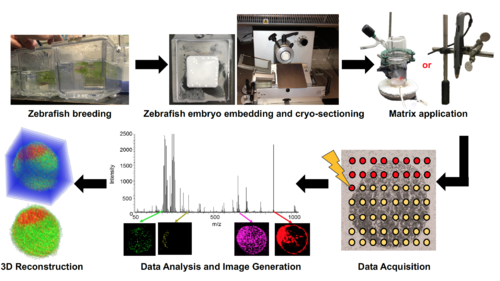
Overall workflow for MALDI-MSI of zebrafish embryos |
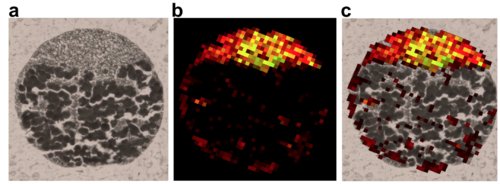
(a) Optical image, (b) overlay MS image of PI (18:0_20:5)(red) and PE (22:6_16:0)(green), and (c) overlay of both lipids and the optical image obtained from tissue section 53. |