
- Title
-
Determining Physical Properties of the Cell Cortex
- Authors
- Saha, A., Nishikawa, M., Behrndt, M., Heisenberg, C.P., J�licher, F., Grill, S.W.
- Source
- Full text @ Biophys. J.

Probing cortical tension in the actomyosin ring of gastrulating zebrafish (A) and in the C. elegans (B) actomyosin cortex of single-cell embryos by COLA. (A) (Left) Schematic of COLA (scissors) in the actomyosin ring of zebrafish. COLA is performed along a 20 �m line (red line) at the stage of 65% epiboly. (Red arrowheads) Direction of cortical recoil after ablation. (Right) Upper images show a time series of cortical NMY-2-GFP after ablation; lower images show the corresponding velocity fields as determined by PIV. (B) (Left) Schematic of COLA on the actomyosin cortex of the C. elegans zygote. COLA is performed along a 10 �m line in parallel to the AP axis of the embryo. (Red arrowheads) Direction of cortical recoil after ablation. (Right) Upper images, time series of cortical NMY-2-GFP after ablation; lower images, corresponding velocity fields as determined by PIV. |

COLA response in zebrafish and C. elegans. (A and B) Illustration of the analysis of the cortical response to COLA. (A) The time evolution of the cut boundary opening was characterized by fitting an ellipse to the cut boundary and measuring the minor radius of the fitted ellipse (white solid line). To analyze the regrowth of the cortical NMY-2 after the cut, we measured the average fluorescence intensity within the box (white broken line). The size of the box is 1.8 � 1.4 �m for zebrafish and 1.4 � 1.2 �m for C. elegans. (B) To obtain the velocity profile along the direction perpendicular to the cut line (red line), the x components of the velocity vectors inside the rectangular area surrounded by the orange broken line were averaged in the y direction (box size, zebrafish: 27 � 13 �m, C. elegans: 12 � 10 �m). (C and F) Velocity profile along the direction perpendicular to the cut line at the time just after the cut for zebrafish (C) and C. elegans (F). (D and G) Time evolution of the minor radius of the fitted ellipse to the cut boundary for zebrafish (D) and C. elegans (G). (E and H) Average concentration of cortical NMY-2 as a function of time after the cut opening for zebrafish (E) and C. elegans (H). (Red) Experimental results in zebrafish (C-E) and C. elegans (F-H). Error bars represents standard error, with n = 15 for all cases. (Blue lines) Theory curves utilizing the obtained least square fit parameters, see main text. |
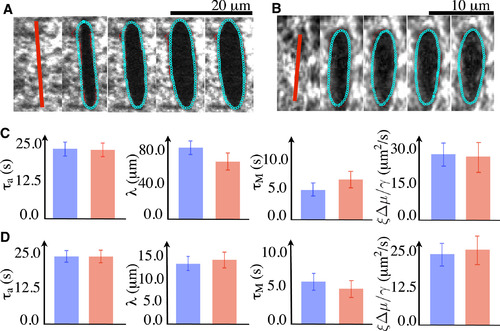
Determination of physical parameters by comparing the COLA responses observed in experiment to the computed response from the theory. (A and B) Representative examples of fitting the cut opening boundary in response to COLA of the actomyosin ring in zebrafish during epiboly (A) and the cortex in a single-cell embryo of C. elegans (B). (Red points) Automatically detected boundaries of the cut opening. Distances between the computed and the detected boundaries were minimized to find the best-fit parameter values. (Cyan) The theoretical boundaries that best fit the experimental ones. Images are 1 s apart. (C and D) Comparison of physical parameter values between the two methods utilized. (Red) The best-fit parameter values were determined by comparing the experimentally determined regrowth of the cut region, spatial decay of the outward velocity profile, and the time evolution of the cut opening boundary to theoretical prediction (see Fig. 2). (Blue) The best-fit parameter values obtained by comparing the cut opening boundaries between experiment and theory (see A and B). Note that both fitting procedures converge to similar values. Error bars are the 95% confidence interval of the mean with n = 15 for zebrafish and n = 10 for C. elegans. |