
- Title
-
Epilepsy in kcnj10 Morphant Zebrafish Assessed with a Novel Method for Long-Term EEG Recordings
- Authors
- Zdebik, A.A., Mahmood, F., Stanescu, H.C., Kleta, R., Bockenhauer, D., and Russell, C.
- Source
- Full text @ PLoS One
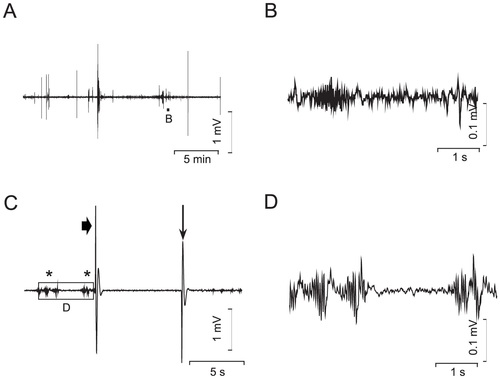
Invasive recordings using a patch pipette inserted into the optic tectum of 120 hpf old ZF larvae. (A), 22 min recording of a buffer-injected control larva. Frequent spiking and also low level activity is present throughout the trace. (B), higher temporal and voltage resolution of the area marked in A. (C), kcnj10a morphant larva, showing genuine epileptic activity (marked with stars). Low-level activity is followed by a spontaneous large transient (arrowhead). Similar transients were seen while the fish showed brief total body contractions and could also be produced by a light tap on the recording setup (vertical arrow). The square marked “D” in C is shown in (D) at higher resolution. PHENOTYPE:
|

Non-invasive recordings using a patch pipette on the surface of the optic tectum. (A) Photo of the non-invasive EEG ZF recording set-up. To the left is a surface recording pipette, filled with 1 M NaCl. In the upper right is the reference electrode. Both are connected to the amplifier, as shown in the schematic in (B). The mounted fish is positioned on a microscope with which ZF viability can be monitored continuously. (C), long-term EEG recording of a kcnj10a morphant fish initially paralyzed in 20 mM D-tubocurarine. Fish were generally viable for over an hour, but paralysis appeared to wear off after 50 to 60 min. Movement artifacts ensued, associated with electrical activity and visible twitching (arrowhead). A 5 s period indicated by a box in C is represented above the trace in higher resolution. PHENOTYPE:
|
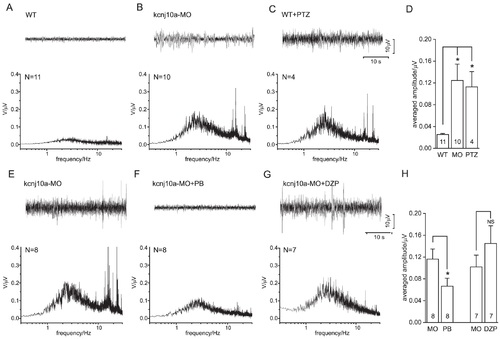
Analysis of surface EEGs. (A-C) Original traces (top) and averaged frequency spectra (below) obtained in WT ZF, kcnj10a morphant ZF and WT ZF pretreated with pentylenetetrazol. (D) The averaged amplitudes (mean over 2-4 Hz) from (A-C) are compared. Note the significant epileptic activity in kcnj10a morphant (MO) and pentylenetetrazol-treated (PTZ) ZF. (E-G) Original traces (top) and averaged frequency spectra (below) obtained in kcnj10a morphant fish, and kcnj10a morphants treated with pentobarbitone (PB) or diazepam (DZP), respectively. (H) Averaged amplitudes (mean over 2-4 Hz) from (E-G) are compared. Note the significant suppression of epileptic activity by PB treatment, and lack of suppression by DZP. PHENOTYPE:
|