
- Title
-
Hedgehog and retinoic acid signaling cooperate to promote motoneurogenesis in zebrafish
- Authors
- Mich, J.K., and Chen, J.K.
- Source
- Full text @ Development

MZsmo zebrafish embryos have patterning defects and lack detectable Hh signaling. (A-C) Wild-type, smo and MZsmo embryos (24 hpf). (D-F) Maternal smo mRNA is present in zygotic smo mutants but depleted in MZsmo embryos. Homozygous smohi1640 embryos could be distinguished from siblings at the shield and bud stages but not at the two-cell stage. Two-cell and shield embryos are viewed laterally; bud-stage embryos are flat-mounted and viewed dorsally, anterior to left. (G-I) Maternal smo-dependent nkx2.2a expression in the zona limitans intrathalamica (arrowheads). (J-O) Wild-type, smo and MZsmo embryos (10 hpf) were either uninjected or injected with shha mRNA and stained for nkx2.2a (primary micrographs) or ptc1 (insets) transcripts. Images are lateral views of the anterior neural plate, anterior to the left. (P) Wild-type and MZsmo embryos were treated as in J-O and analyzed by qRT-PCR. Transcript levels are normalized to the wild-type control; error bars represent s.e.m. Scale bars: 200 μm in A-I; 100 μm in J-O. |

Maternal smo promotes motor activity and motoneurogenesis. (A) Wild-type, smo and MZsmo zebrafish embryos were imaged at 24 hpf during spontaneous twitching. Ten overlaid images taken at 100-msecond intervals are shown. (B) Embryos at 24 hpf were observed for the ability to twitch in response to physical stimulus, spontaneously, or in response to applied voltage. (C-N) Wild-type, smo and MZsmo embryos at the 6-somite (12 hpf, dorsal view) and 18-somite (18 hpf, lateral view) stages were stained for isl1 or isl2a transcripts, which mark ventral PMNs and dorsal RB neurons. Anterior is to the left. Arrowheads in I-K indicate non-PMN isl1-labeled interneurons that preclude accurate counting of isl1-positive PMNs at this developmental stage. (O) Average number of isl1-positive or isl2a-positive PMNs per embryo for each genotype and developmental stage. For each condition, 100-200 PMNs were counted. nd, not determined owing to technical challenges in quantifying PMNs at this stage. Error bars represent s.e.m. **, P<0.01; ***, P<0.001. Scale bars: 200 μm. |

Gli-dependent patterning in the absence of Smo. (A-L) Zebrafish embryos obtained from wild-type, gli2aty17/+ or gli1ts269/+ incrosses (18 hpf) were treated with either ethanol (EtOH) or 100 μM cyclopamine and stained for ptc1 or isl2a transcripts. The trunk region between approximately the third and twelfth somites is shown laterally, anterior to the left. Arrowheads in D-F show basal ptc1 expression in the neural tube; arrowheads in H,I show disorganized PMNs in gli2aty17/ty17 and gli1ts269/ts269 embryos. (M) Quantification of PMNs in wild-type embryos and those resulting from incrosses of gli2aty17/+ or gli1ts269/+ zebrafish after treatment with either ethanol or 100 μM cyclopamine. Homozygous gli2aty17 and gli1ts269 mutants were identified by the absence of hindbrain cranial motoneurons, which cannot be assessed after cyclopamine treatment. *, P<0.05; ***, P<0.001; n.s., not significant. Bar indicates the mean. (N) Quantification of PMNs in MZsmo embryos treated as indicated. Error bars represent s.e.m. ***, P<0.001, compared with control MZsmo embryos. Scale bar: 100 μm. |

Retinoic acid signaling promotes motoneurogenesis and basal Gli activity. (A) Quantification of isl2a-positive PMNs at 18 hpf after treatment with DEAB and/or RA. Error bars represent s.e.m. ***, P<0.001. (B-G) Wild-type and MZsmo zebrafish embryos (14 hpf) were treated with DMSO, 10 μM DEAB or 100 nM RA and stained for ptc1 transcripts to assess the Hh pathway state. Embryos are flat-mounted, anterior to the left and viewed dorsally, with arrowheads demarcating the neural tube region. (H,I) Quantification of gli2b expression in the neural tubes of wild-type or MZsmo embryos treated with DMSO, 10 μM DEAB or 100 nM RA and then stained for gli2b transcripts. Data are the average of at least five embryos per condition � s.e.m. (J-O) Representative images of embryos treated, stained and quantified as described for H,I, with the analyzed regions highlighted in white brackets. Scale bars: 200 μm. |

Maternal smo promotes patterning of the adenohypophyseal placode. (A-C) Wild-type, smo and MZsmo embryos were stained for pax6a transcripts, which label the anterior boundary of the anterior neural plate at bud stage (10 hpf) and the adenohypophysis by 24 hpf (arrowheads). Insets in B and C depict embryos with less severe anterior pituitary defects within the group. (D-F) Riboprobes against fzd8b were used to mark the anterior neural plate in bud-stage embryos and the neurohypophysis in 24-hpf embryos. (G-I) Immunofluorescence using the zl-1 antibody marks normal and ectopic (arrowheads) lens fiber tissue, which is slightly disorganized in MZsmo embryos. Embryo orientations: A-F (bud stage), dorsal view of anterior pole and anterior to the top; A-C (24 hpf), ventroanterior view and anterior to the top; D-F (24 hpf), lateral view and anterior to the left; G-I, ventroanterior view and anterior to the top. Scale bars: 200 μm in A-F; 100 μm in G-I. |

Maternal smo does not promote muscle patterning in the absence of zygotic smo. Embryos were fixed at 24 hpf and stained with (A) F59 antibody to label myosin heavy chains expressed in superficial slow-twitch myofibers and muscle pioneer cells or (B) F310 antibody to detect myosin light chains expressed in the fast-twitch myofibers. All embryos are viewed laterally, anterior to the left. Arrowheads in A highlight sporadic slow-twitch fibers. Scale bar: 50 μm. |
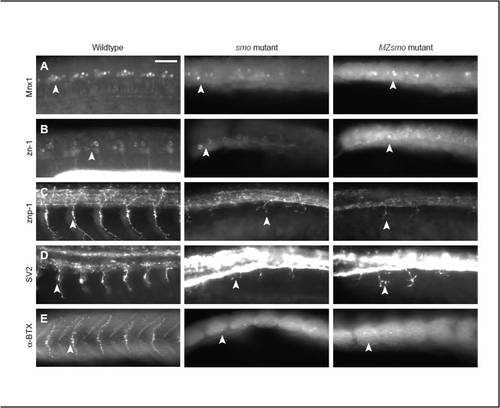
PMNs in MZsmo mutants retain native identity and activity. Wild-type, smo and MZsmo embryos were fixed at 24 hpf and stained for a battery of PMN markers. All embryos are viewed laterally, anterior to the left. Arrowheads highlight PMN staining. (A,B) The PMN markers Mnx1 (A) and zn-1 (B) confirm that PMNs in MZsmo mutants retain native identity despite the complete lack of Hh signaling. (C) The motor axon marker znp-1 demonstrates that smo and MZsmo PMNs have a similar ability to extend axons, albeit shorter than their wild-type counterparts. (D) Immunostaining with the SV2 antibody, which labels synaptic vesicles of active axons, indicates that smo and MZsmo PMN axons have similar intrinsic activity. (Higher levels of SV2 staining are observed in the neural tube in smo and MZsmo embryos.) (E) Labeling with the nicotinic acetylcholine receptor binding peptide α-bungarotoxin, which binds to neuromuscular junction nicotinic acetylcholine receptors, indicates that smo and MZsmo PMNs axons retain some ability to induce clustering of these receptors. Scale bar: 50 μm. |

Cyclopamine (100 μM) results in near complete loss of Smo activity. Wild-type embryos, MZsmo mutants and wild-type embryos treated with 100 μM cyclopamine from the one-cell stage were cultured until the 18-somite stage, fixed, and stained for ptc1 transcripts. Trunk regions spanning approximately the eighth to twelfth somites are shown. Scale bar: 25 μm. |

Gli-targeting MOs modulate Hh pathway state and PMN formation without perturbing RB neuron development. (A-O) MZsmo embryos were uninjected (A-C) or injected with MOs targeting gli2b (D-F), gli1 (G-I), gli2a/gli2b/gli3 (J-L) or gli2a/gli3 (M-O) and then grown to the 18-somite stage (18 hpf), fixed, and stained for (A,B,D,E,G,H,J,K,M,N) ptc1 transcripts to assess Hh pathway state or (C,F,I,L,O) isl2a transcripts to visualize ventrally positioned PMNs and dorsally positioned RB sensory neurons. Embryos are viewed laterally, anterior to the left, and the trunk region spanning approximately the eighth and tenth somites is shown. Knockdown of gli2b diminishes neural tube ptc1 expression in the trunk but expands it slightly in the hindbrain. Scale bar: 50 μm. |

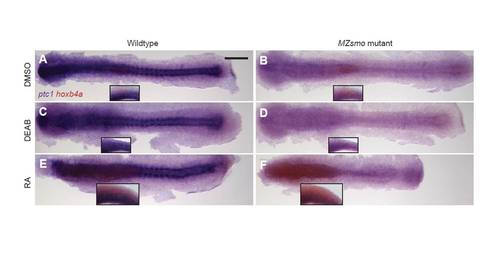
RA signaling can be modulated pharmacologically, independently of Hh signaling. (A) Bright-field images of 24 hpf wild-type and MZsmo embryos treated with vehicle, the Aldh1a2 inhibitor DEAB (10 μM), or DEAB with 10 nM RA to restore RA signaling. (B,C) Wild-type (B) and MZsmo (C) embryos were treated with the indicated modulators and then fixed at 24 hpf and stained for hoxb4a to assess RA signaling levels in the posterior hindbrain/anterior spinal cord (curved brackets), brain and eyes. (D) Wild-type embryos were treated with the indicated compounds and then fixed at the 10-somite stage and stained for cyp26a1, a RA-responsive gene in the tailbud and anterior trunk. Embryos are shown as flat mounts and viewed dorsally, anterior to the left. The arrowhead indicates tailbud cyp26a1 expression that escapes DEAB treatment. Scale bars: 200 μm. |
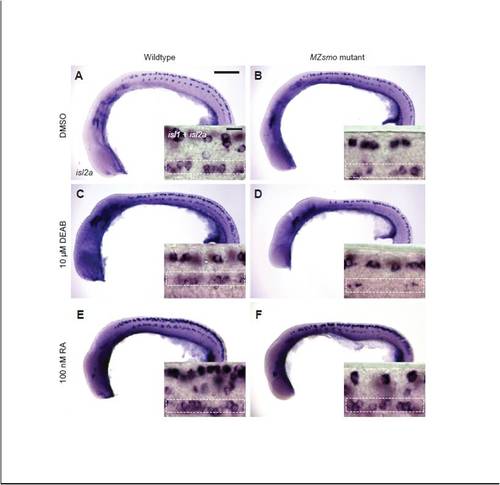
RA signaling promotes PMN induction in the absence of Hh signaling. (A-F) Wild-type or MZsmo embryos were treated with DMSO, DEAB (10 μM) or RA (100 nM) from the one-cell stage to the 18-somite stage and then fixed. The embryos were then stained for isl2a transcripts to mark caudal and variable PMNs (primary micrographs) or both isl1 and isl2a transcripts to mark all PMNs (insets). Inset images are high magnification micrographs of the region spanning approximately the ninth and eleventh somites, where isl1 does not label non-PMN neurons in wild-type embryos. Dashed boxes denote PMNs within each inset image. All embryos are viewed laterally, anterior to the left. Scale bars: 200 μm in primary micrographs; 20 μm in insets. |

RA promotes formation of RB sensory neurons independently of Hh signaling or Gli1 activity. (A-H) Wild-type (A-D) or MZsmo (E-H) embryos were uninjected (A,C,E,G) or injected with gli1 MO (B,D,F,H), treated with DMSO (A,B,E,F) or 100 nM RA (C,D,G,H), and then grown to 18 hpf. The embryos were then fixed and stained for isl2a transcripts to mark ventrally localized PMNs and dorsally localized RB sensory neurons. Arrowheads show RB neurons in the dorsal neural tube that are induced by RA in all conditions. Embryos are viewed laterally, anterior to the left. Scale bar: 200 μm. |
Pharmacological modulation of RA signaling in wild-type and MZsmo embryos. (A-F) Wild-type (A,C,E) or MZsmo (B,D,F) embryos (10-somite stage, 14 hpf) were treated with (A,B) DMSO, (C,D) 10 �M DEAB or (E,F) 100 nM RA and stained for ptc1 (purple) and hoxb4a (red) transcripts to assess Hh and RA pathway states, respectively. Embryos are shown as flat mounts and viewed dorsally (primary micrographs) or laterally (insets), anterior to the left. Scale bar: 200 μm. |

Endogenous RA signaling does not detectably modulate gli1 expression within the neural tube. (A-F) Wild-type or MZsmo embryos (14 hpf) were treated with DMSO, 10 μM DEAB or 100 nM RA and stained for gli1 transcripts. Embryos are flat-mounted, anterior to the left and viewed dorsally. Scale bar: 200 μm. |

Hh signaling, basal Gli activity and RA signaling cooperate to promote motoneuron progenitor patterning. (A-O) Embryos were treated with (A,D,G,J,M) DMSO, (B,E,H,K,N) 100 μM cyclopamine, or (C,F,I,L,O) 100 μM SANT75, in combination with (D-F) 10 μM DEAB, (G-I) a gli1 MO, (J-L) genetic loss of gli1 function (gli1ts269 mutant), or (M-O) a gli2b MO. The embryos were then fixed at the bud stage and stained for olig2 transcripts to mark motoneuron progenitors. Scale bar: 100 μm. |
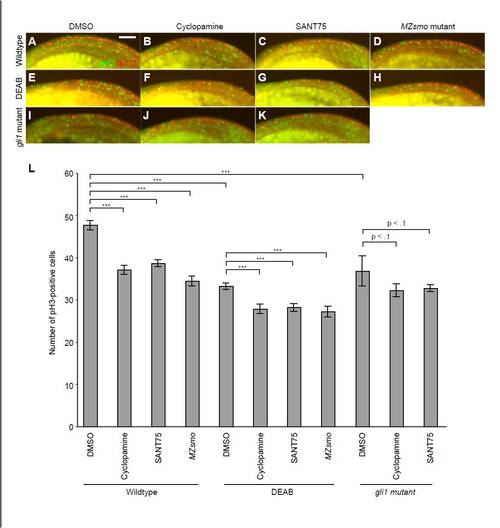
Hh signaling, basal Gli activity and RA signaling cooperate to promote cell proliferation in the anterior spinal cord. (A-K) Embryos cultured with (A,E,I) DMSO, (B,F,J) 100 μM cyclopamine, or (C,G,K) 100 μM SANT75, as well as (D,H) MZsmo mutants, were co-treated with (E-H) 10 �M DEAB. gli1 mutants were similarly treated with DMSO (I) or the Smoothened antagonists (J,K). The embryos were then fixed at the 18-somite stage and stained for phosphohistone H3 (pH3; green) to mark mitotic cells and Isl1/2 (red) to label the posterior neural tube. The Isl1/2-expressing cells were used to determine the dorsoventral and mediolateral positions of the neural tube, which can also be morphologically distinguished from overlying skin cells. Lateral views of the neural tube between approximately the first and eighth somites are shown, anterior to the left. The bright yellow fluorescence at the bottom of each micrograph is yolk autofluorescence. (L) Quantification of pH3-positive cells in the anterior neural tube between the first and eighth somites. Data are the average number of pH3-positive cells per embryo � s.e.m. ***, P<0.001. Five embryos were analyzed for the gli1 mutant phenotypes, and at least 10 embryos were evaluated for all other conditions. Scale bar: 50 μm. |