
|
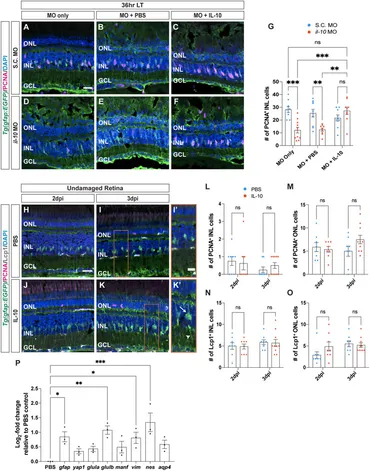
Fig. 5 Cytokine IL-10 is necessary, but not sufficient, for Müller glia proliferation. (A–F) Confocal images of retinas from albino;Tg(gfap:EGFP)nt11 zebrafish that were electroporated with Standard Control (S.C.; (A–C) or il-10 morpholinos (D–F) prior to the start of constant light treatment and intravitreally injected with either MO only (A,D), PBS (B,E) or recombinant IL-10 protein (C,F), and placed in LT. Retinal sections were collected at 36 h LT and immunolabeled for GFP (Müller glia, green) and PCNA (proliferating cells, magenta), with DAPI counterstain (nuclei, blue). (G) Quantifications of the numbers of PCNA+ INL cells under different conditions. Müller glia proliferation was rescued in il-10 morphants injected with IL-10 protein. (H–K) Confocal images of albino;Tg(gfap:EGFP)nt11 retinas that were injected with either PBS (H,I) or recombinant IL-10 protein (J,K) in undamaged retinas every 24 h. Retinal sections were collected at 2- and 3-days following the first injection (dpi) and immunolabeled to detect GFP (Müller glia, green) and PCNA (proliferating cells, magenta), with DAPI counterstain (nuclei, blue). Red boxes in I and K were magnified to better portray the EGFP signal in the hypertrophied Müller glia (I’,K’). Arrow and arrowhead mark a hypertrophied cell body and process, respectively. (L–O) Quantifications of the numbers of PCNA+ cells (L, M) and Lcp1+ cells (N,O) in the INL (L,N) and ONL (M,O). (P) qRT-PCR analysis of gliotic-associated gene expression in undamaged retinas injected with IL-10 protein and collected at 3dpi. Data was normalized to 18 s rRNA reference gene and displayed as log2-fold change relative to the PBS (vehicle) control group. For the qRT-PCR, three independent replicates were performed with a pool of 6-7 dorsal retinas for each replicate. Cell count quantifications (G,L–O) were normalized to 300 μm along the length of the central-dorsal retina. Statistical analyses were performed using either a two-way ANOVA (G,L–O) or one-way ANOVA (P) both followed by Bonferroni’s post hoc test. Graphs represent the Mean ± SEM and n ≥ 8. *, p < 0.05, **, p < 0.01; ***, p < 0.001; ns, no significance. ONL, outer nuclear layer; INL, inner nuclear layer; GCL, ganglion cell layer. Scale bars in (A,H) are 20 μm and are the same for (B–F) and (I–K), respectively. Scale bar in (I′) is 10 μm and is the same for (K’).