IMAGE

Fig 2

ID
ZDB-IMAGE-240612-12
Source
Figures for Prykhozhij et al., 2024
Image
Figure Caption

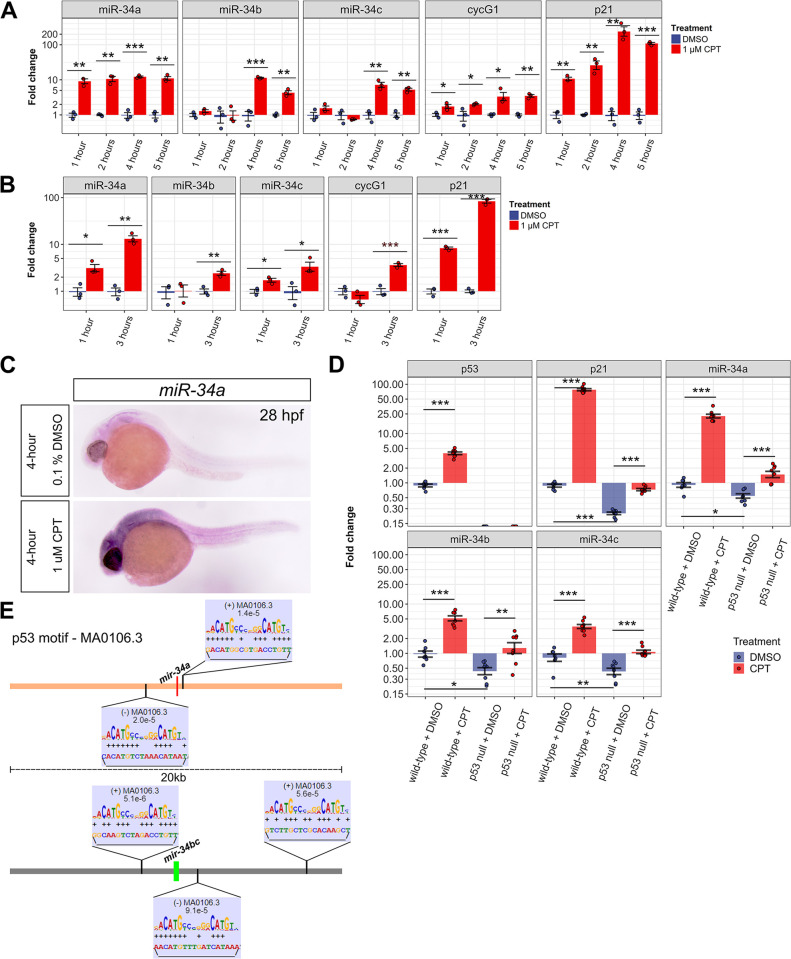
Fig 2 p53 induces all miR-34 genes in zebrafish but with different kinetics.

(A) Quantitative PCR (qPCR) analysis of miR-34 genes (miR-34a, miR-34b, miR-34c) as well as p53 target genes p21 and cycG1 after 1, 2, 4 and 5 hours of treatments at 24 hpf with 0.1% DMSO or 1μM camptothecin (CPT), which induces DNA damage and p53 activation. (B) qPCR analysis of miR-34 genes as well as p53 target genes p21 and cycG1 after 1 and 3 hours of treatments at 48 hpf with 0.1% DMSO or 1 μM CPT. (A, B) The qPCR experiment was run with 4 biological replicates and 2 technical replicates. (C) Whole mount in situ hybridization analysis of miR-34a expression pattern after 4-hour treatment with DMSO or CPT in wild-type zebrafish embryos. Representative images of 40 embryos stained per condition are shown. (D) qPCR for p53 target genes (p53, p21) and miR-34 genes in wild-type and p53 null mutants after a 4-hour treatment at 24 hpf with either 0.1% DMSO or 1μM CPT. The qPCR experiment was run with 7 or 8 biological replicates and 2 technical replicates. Fold changes for each gene are indicated on the log10-scaled y-axis relative to control. Standard errors are used for error bars. Significantly different genes in (A, B, D) are indicated by ‘***’ (P-value < 0.001), ‘**’ (P-value < 0.01) and ‘*’ (P-value < 0.05). (E) Positions and alignments of the p53 transcription factor motif in the 20-kb regions around the miR-34a and miR-34b/c genes performed using the MAST software. The alignment figure position above or below the genomic sequence line indicates the strand (+ or -, respectively). The P-values for the motif matches are indicated on the alignment inserts.

Acknowledgments
This image is the copyrighted work of the attributed author or publisher, and ZFIN has permission only to display this image to its users. Additional permissions should be obtained from the applicable author or publisher of the image. Full text @ PLoS Genet.