
|
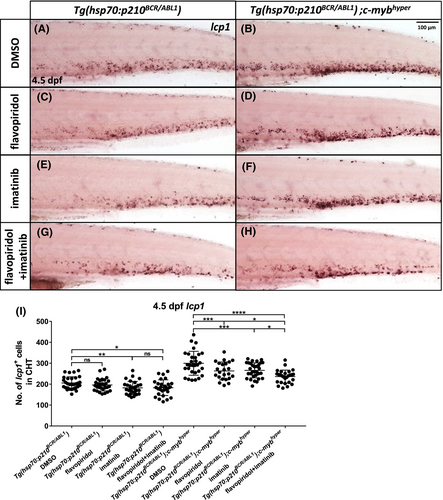
Fig. 4 Combined treatment with flavopiridol and imatinib had a better response in Tg(hsp70:p210BCR/ABL1);c-mybhyper. (A–H) WISH of lcp1 expression in the drug-treated larvae at 4.5 dpf. After heat shock treatment, 2.5 dpf Tg(hsp70:p210BCR/ABL1) and Tg(hsp70:p210BCR/ABL1);c-mybhyper were treated for 48 h with 1‰ DMSO control, 0.1 μmol/L flavopiridol, 80 μmol/L imatinib, or 0.1 μmol/L flavopiridol combined with 80 μmol/L imatinib. (I), Quantification of numbers of 4.5 dpf lcp1+ cells in CHT (Tg(hsp70:p210BCR/ABL1) DMSO, n = 30; Tg(hsp70:p210BCR/ABL1) imatinib, n = 29; Tg(hsp70:p210BCR/ABL1) flavopiridol, n = 30; Tg(hsp70:p210BCR/ABL1) flavopiridol+imatinib, n = 29; Tg(hsp70:p210BCR/ABL1);c-mybhyper DMSO, n = 30; Tg(hsp70:p210BCR/ABL1);c-mybhyper imatinib, n = 31; Tg(hsp70:p210BCR/ABL1);c-mybhyper flavopiridol, n = 30; Tg(hsp70:p210BCR/ABL1);c-mybhyper flavopiridol+imatinib, n = 27). Scale bar, 100 μm; applies to panels (A–H).