Image
Figure Caption

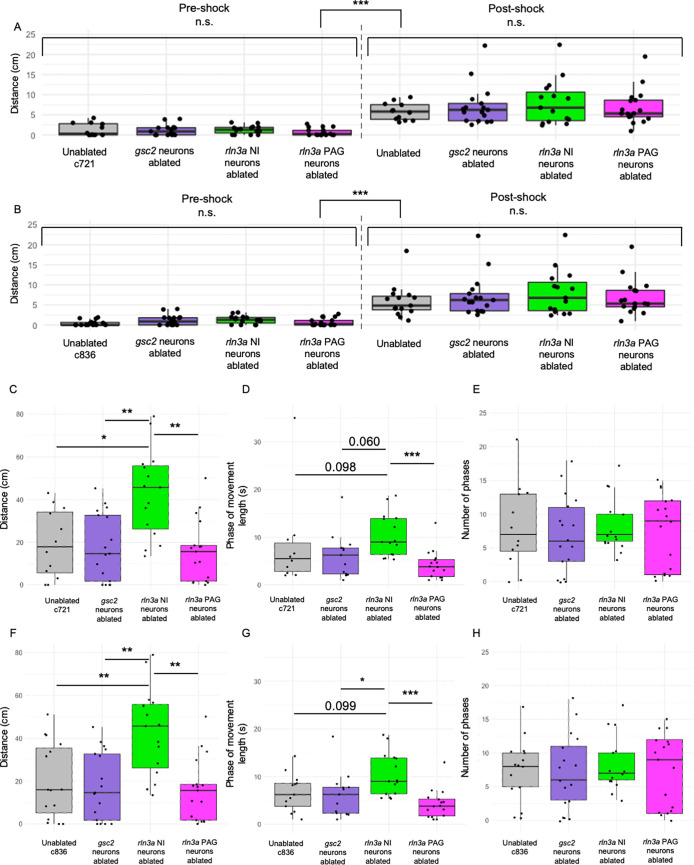
Figure 8—figure supplement 3. Comparisons between ablated and unablated larvae with the same genotype.

Unablated control group only includes only Tg(gsc2:QF2)c721; Tg(QUAS:GFP)c578 (A, C, D, E) or Tg(rln3a:QF2, he1.1:YFP)c836; Tg(QUAS:GFP)c578 (B, F, G, H) siblings of ablated larvae. (A, B) Mean of distance traveled during 5 s pre- and post-shock. (A) Unablated c721: pre=1.30±0.46 cm, post=5.80±0.61 cm. (B) Unablated c836: pre=0.51±0.18 cm, post=5.96±1.07 cm. (C, F) Mean of distance traveled during the first 115 s of the recording. (C) Unablated c721=19.33±4.59 cm. (F) Unablated c836=20.29±4.55 cm. (D, G) Average length of phases of movement during the pre-shock period, defined as continuous phases of movement with no more than one second of prolonged immobility. (D) Unablated c721=8.28 ± 3.11 s. (G) Unablated c836=6.64±1.07 s. (E, H) Mean number of phases of movement during the pre-shock period. (E) Unablated c721=8.17±1.99. (H) Unablated c836=7.4±1.30. All other groups have the same values as in Figure 8. (A, B) Kruskal-Wallis rank sum test: (A) ***p=4.74 x 10⁻¹⁵, (B) ***p=2.85 x 10⁻¹⁶. (A, B) Dunn’s post-hoc tests with adjustment for multiple comparisons show no statistically significant differences within pre- and post-shock epochs, p<0.001*** for each pre-shock vs. post-shock comparison. (C) Kruskal-Wallis rank sum test: **p=0.0012. Dunn’s post-hoc tests with adjustment for multiple comparisons show ablated rln3a NI neurons vs. unablated *p=0.012, ablated rln3a vs. gsc2 NI neurons **p=0.0023, or ablated rln3a NI vs. rln3a PAG neurons **p=0.0023. (D) Kruskal-Wallis rank sum test: **p=0.0018. Dunn’s post-hoc tests with adjustment for multiple comparisons show ablated rln3a NI neurons vs. unablated p=0.098, ablated rln3a vs. gsc2 NI neurons p=0.060, or ablated rln3a NI vs. rln3a PAG neurons ***p=0.00076. (F) Kruskal-Wallis rank sum test: **p=0.0012. Dunn’s post-hoc tests with adjustment for multiple comparisons show ablated rln3a NI neurons vs. unablated **p=0.0078, ablated rln3a vs. gsc2 NI neurons **p=0.0022, or ablated rln3a NI vs. rln3a PAG neurons **p=0.0022. (G) Kruskal-Wallis rank sum test: **p=0.0012. Dunn’s post-hoc tests with adjustment for multiple comparisons show ablated rln3a NI neurons vs. unablated p=0.099, ablated rln3a vs. gsc2 NI neurons ablated *p=0.042, or ablated rln3a NI vs. rln3a PAG neurons ***p=0.00049. (E, H) Kruskal-Wallis rank sum test: (E) p=0.87, (H) p=0.90.

Acknowledgments
This image is the copyrighted work of the attributed author or publisher, and ZFIN has permission only to display this image to its users. Additional permissions should be obtained from the applicable author or publisher of the image. Full text @ Elife