
|
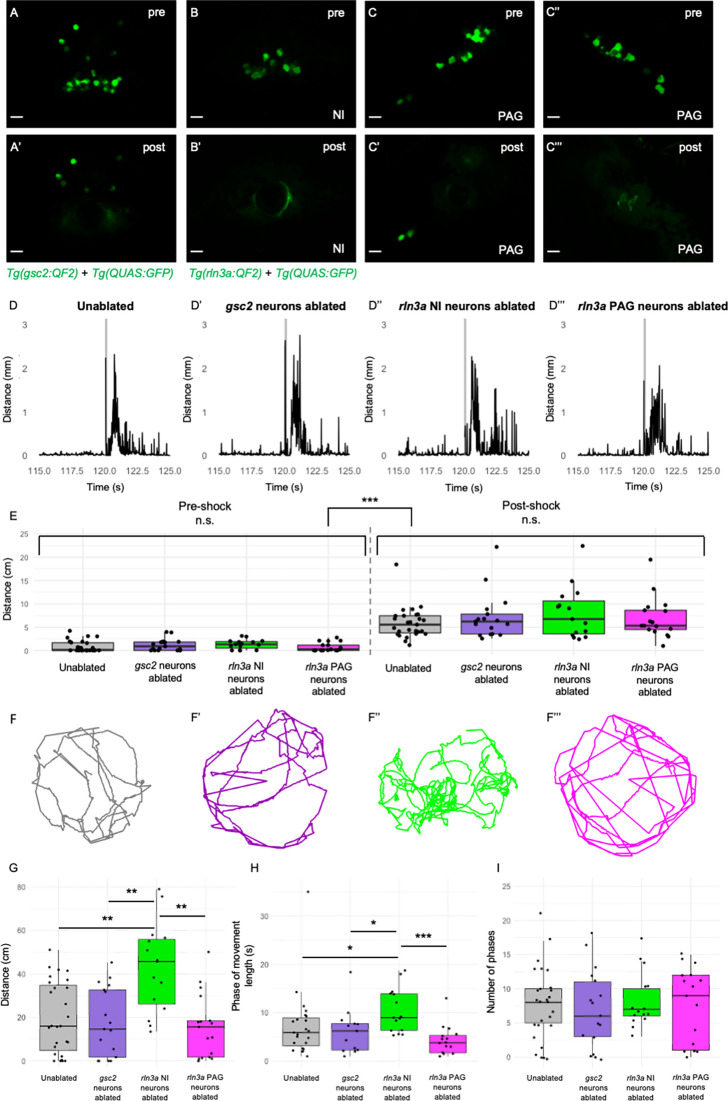
Figure 8—figure supplement 1. Loss of rln3a NI neurons increases spontaneous locomotor activity. (A-C’’’) Single optical sections from two-photon imaging of 6 dpf (A, A’) Tg(gsc2:QF2)c721; Tg(QUAS:GFP)c578 or (B-C’’’) Tg(rln3a:QF2, he1.1:YFP)c836; Tg(QUAS:GFP)c578 larvae (A, B, C, C’’) before and (A’, B’, C’, C’’’) after laser-mediated ablation of (A, A’) gsc2 neurons, (B, B’) rln3a NI neurons, or (C, C’) left and (C’’, C’’’) right rln3a PAG neurons. Dorsal views, anterior to the top. Scale bars, 10 μm. (D-D’’’) Average locomotor activity during 5 s prior to and after shock. Shock delivery is denoted by the gray line. (E) Mean of total distance traveled during 5 s pre- and post-shock for unablated controls (pre=0.86±0.23 cm, post=5.89±0.64 cm, n=27), or larvae with ablated gsc2 (pre=1.19±0.31, post=7.23±1.20 cm, n=17), rln3a NI (pre=1.30±0.26 cm, post=8.09±1.45 cm, n=15), or rln3a PAG (pre=0.72±0.23 cm, post=6.92±1.07 cm, n=17) neurons. Kruskal-Wallis rank sum test: ***p=2.2 x 10⁻¹⁶. Dunn’s post-hoc tests with adjustment for multiple comparisons show no statistically significant differences within pre- and post-shock epochs, p<0.001*** for each pre-shock vs. post-shock comparison. Unablated control group includes Tg(gsc2:QF2)c721; Tg(QUAS:GFP)c578 and Tg(rln3a:QF2, he1.1:YFP)c836; Tg(QUAS:GFP)c578 siblings of ablated larvae. (F-F’’’) Representative trajectories of 7 dpf larvae with ablated (F’) gsc2 (F’’) rln3a NI or (F’’’) rln3a PAG neurons and (F) sibling controls during the first 115 s of the recording (baseline activity). (G) Mean of distance traveled during the first 115 s of the recording for unablated controls (19.87±3.19 cm) or larvae with ablated gsc2 (17.87±3.84193 cm), rln3a NI (42.80±5.27 cm), or rln3a PAG (15.73±3.55 cm) neurons. Kruskal-Wallis rank sum test: ***p=0.00099. Dunn’s post-hoc tests with adjustment for multiple comparisons show ablated rln3a NI neurons vs. unablated **p=0.0019, ablated rln3a vs. gsc2 NI neurons **p=0.0019, or ablated rln3a NI vs. rln3a PAG neurons **p=0.0019. (H) Average length of movement phases during the pre-shock period, defined as continuous phases of movement with no more than 1 s of prolonged immobility, for unablated controls (7.35±1.34 s) or larvae with ablated gsc2 (6.18±1.14 s), rln3a NI (10.38±1.17 s) or rln3a PAG (4.23±0.74 s) neurons. Kruskal-Wallis rank sum test: **p=0.0013. Dunn’s post-hoc tests with adjustment for multiple comparisons show ablated rln3a NI neurons vs. unablated *p=0.039, ablated rln3a vs. gsc2 NI neurons *p=0.039, or ablated rln3a NI vs. rln3a PAG neurons ***p=0.00055. (I) Mean number of phases of movement during the pre-shock period for unablated controls (7.74±1.03) or larvae with ablated gsc2 (6.88±1.39), rln3a NI (8.13±1.05), or rln3a PAG (7.41±1.33) neurons. Kruskal-Wallis rank sum test: p=0.89.