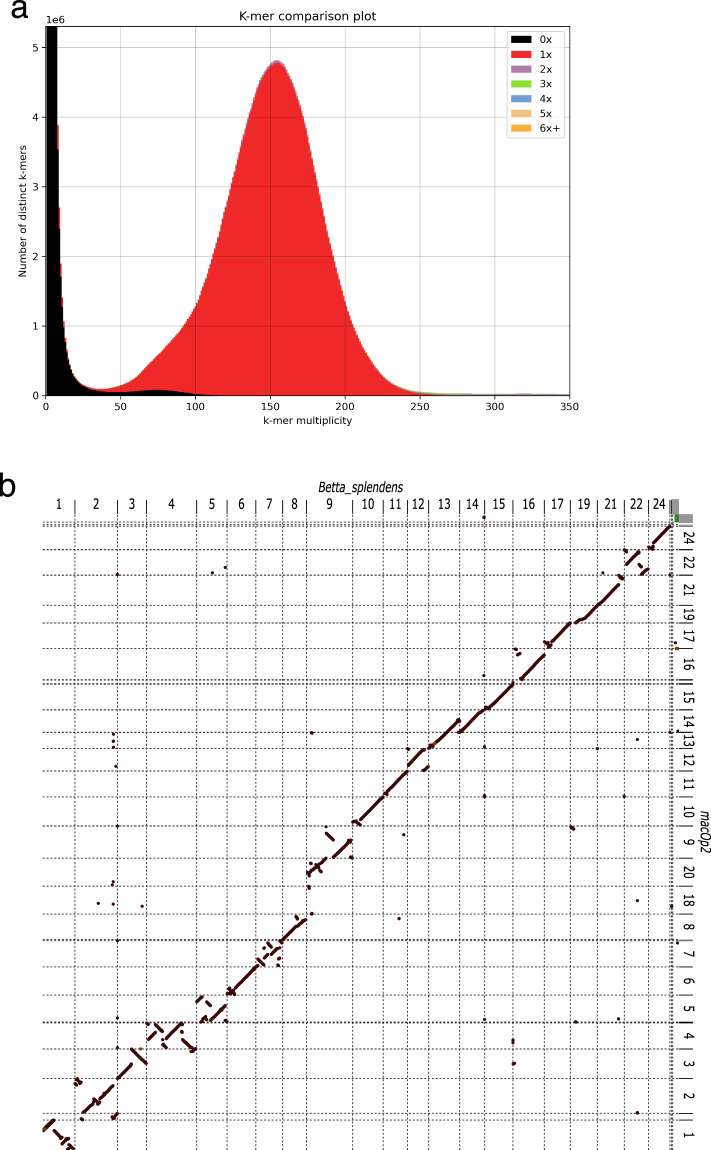
IMAGE

Fig. 1

ID
ZDB-IMAGE-240528-29
Source
Figures for Fodor et al., 2024
Image
Figure Caption

Fig. 1

Basic genome assessment. (a) K-mer comparison plot showing copy number of the k-mers as a stacked histogram colored by the copy numbers found in the paradise fish draft genome assembly. The y-axis represents the number of distinct k-mers, and the x-axis shows the k-mer multiplicity (coverage). Most k-mers are represented once (red peak) indicating high quality for the genomic assembly. (b) Whole genome alignment of the B. splendens genome assembly to the M. opercularis assembly. B. splendens is on the X-axis and M. opercularis on the Y-axis. B. splendens chromosomes 9 appears to map to two separate M. opercularis chromosomes and M. opercularis chromosome 18 does not appear to have a clear homologous chromosome in B. splendens. Chromosome numbering is based on B. splendens alignment to medaka chromosomes14,20.

Acknowledgments
This image is the copyrighted work of the attributed author or publisher, and ZFIN has permission only to display this image to its users. Additional permissions should be obtained from the applicable author or publisher of the image. Full text @ Sci Data