
|
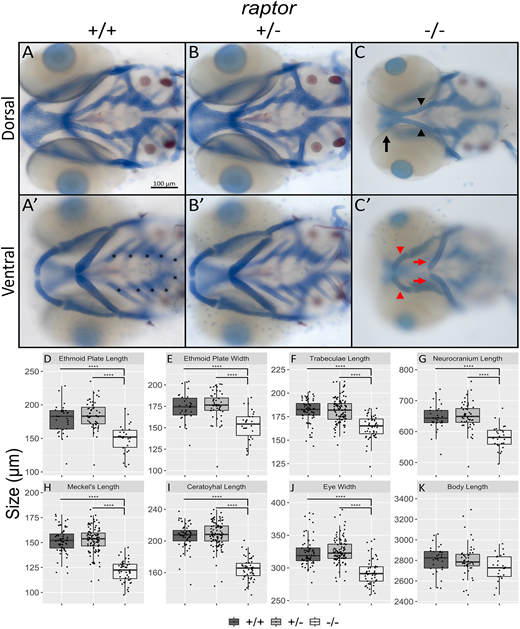
Fig. 4 The craniofacial skeleton and eyes are reduced in raptor mutant fish. (A-C′) Dorsal and ventral views of 4 dpf fish, anterior towards the left. (A-B′) Wild-type (A,A′) and heterozygous (B,B′) fish are indistinguishable from one another. Asterisks in A′ indicate the ceratobranchial cartilages. (C,C′) Mutant fish have dramatically smaller craniofacial skeletal elements and eyes. Mutants display several craniofacial defects, including a smaller ethmoid plate (C, black arrowheads), smaller trabeculae (C, black arrow), loss of ceratobranchials (C), smaller Meckel's cartilage (C′, red arrowheads) and smaller ceratohyal (C′, red arrows). (D-K) Linear measurements of (D) ethmoid plate length, (E) ethmoid plate width, (F) trabecula length, (G) neurocranium length, (H) Meckel's cartilage length, (I) ceratohyal length, (J) eye width and (K) body length. Statistically significant reductions in all measurements except body length were present in mutants. The statistical analyses were conducted using one-way ANOVA followed by Tukey's honest significant difference (HSD) post-hoc test for multiple comparisons, ****P<0.0001. The top and bottom of each box correspond to the third quartile (Q3) and first quartile (Q1), respectively. Each box covers the interquartile range (IQR), where 50% of the data lies. The median is depicted by the horizontal line within each box. The upper whisker extends to the largest value within Q3 + 1.5 * IQR. The lower whisker extends to the smallest value within Q1 - 1.5 * IQR. Any data point outside these whiskers is classified as an outlier. See Mcgill et al. (1978).