
|
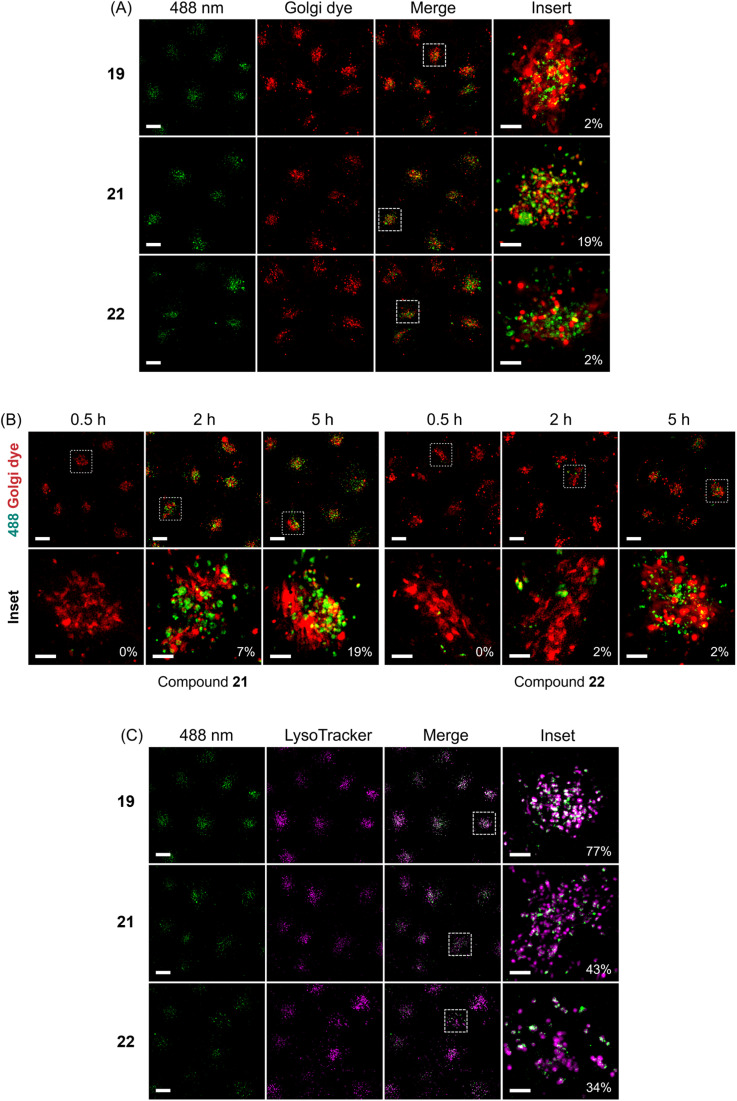
Fig. 4 (A) Colocalization analysis of compounds (G1–NH2–) 19, (G2–NH2–) 21, (G2–guanidine–) 22 with Golgi stain — BODIPY® TR ceramide. Green dots indicate fluorescence generated from compounds. Red color indicates Golgi. The orange color indicates colocalized pixels. (B) Colocalization analysis of compounds (G2–NH2–) 21, (G2–guanidine–) 22 with Golgi stain — BODIPY® TR ceramide at different time points. Green dots indicate fluorescence generated from compounds. Red color indicates Golgi. The orange color indicates colocalized pixels. (C) Colocalization analysis of compounds (G1–NH2–) 19, (G2–NH2–) 21, (G2–guanidine–) 22 with LysoTracker® Deep Red. Green dots indicate fluorescence generated from compounds. Purple dots indicate lysosomes. The white color indicates colocalized pixels. HeLa cells were incubated with 50 μM of compound in the dark at 37 °C for 5 h. Scale bar for the overview represents 10 μm. Scale bar for the inset represents 1 μm. Colocalization indicated as percentage.