IMAGE

Fig. 4

ID
ZDB-IMAGE-240426-88
Source
Figures for Raote et al., 2024
Image
Figure Caption

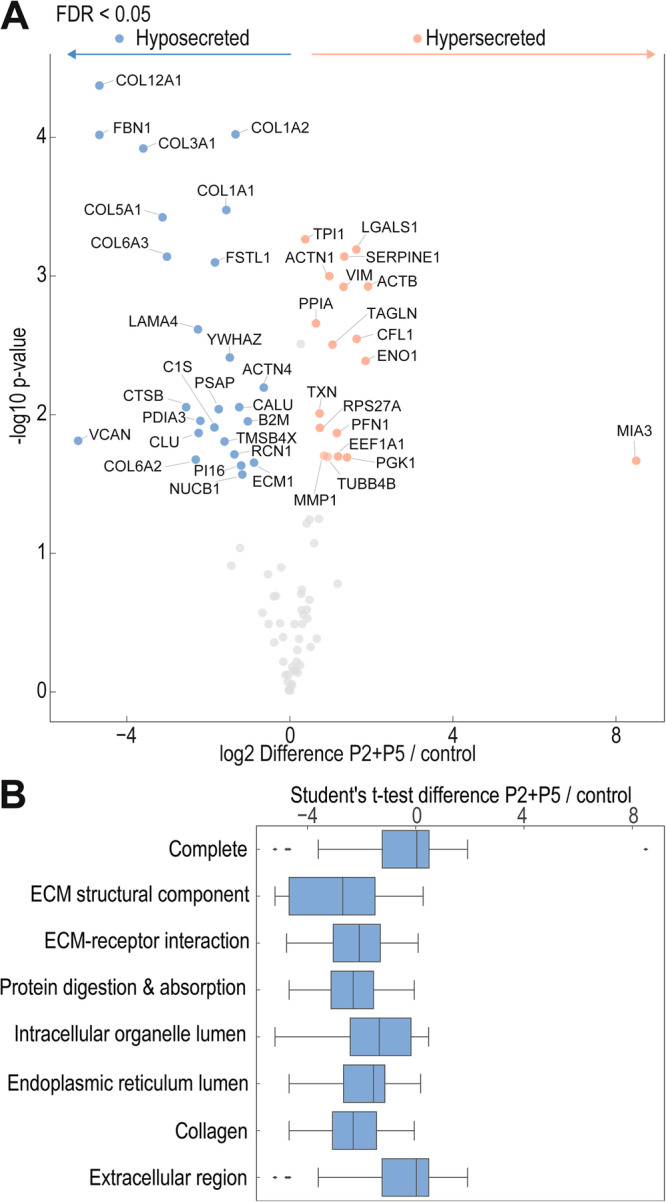
Fig. 4 Effects of peptide treatment on the secretome of human fibroblasts.

A Volcano plot illustrating significantly downregulated (blue symbols) and upregulated (orange symbols) proteins, by treatment of primary human dermal fibroblasts with 40 μM P2 + P5 for 20 h in serum-free conditions in comparison to control samples. Unpaired two-sided Student´s t-test, S0 = 0.1, N = 3 independent samples. B Gene ontology (GO) terms of proteins affected by peptide treatment. Box plot represents the median, 25th and 75th percentiles, max. and min. are connected through whiskers. Outliers are defined as Q1−1.8 interquartile range (IQR) and Q3 + 1.8 IQR. An unpaired two-sided Student´s test was performed.

Acknowledgments
This image is the copyrighted work of the attributed author or publisher, and ZFIN has permission only to display this image to its users. Additional permissions should be obtained from the applicable author or publisher of the image. Full text @ Nat. Commun.