IMAGE

Fig. 4

ID
ZDB-IMAGE-240419-99
Source
Figures for Morizet et al., 2024
Image
Figure Caption

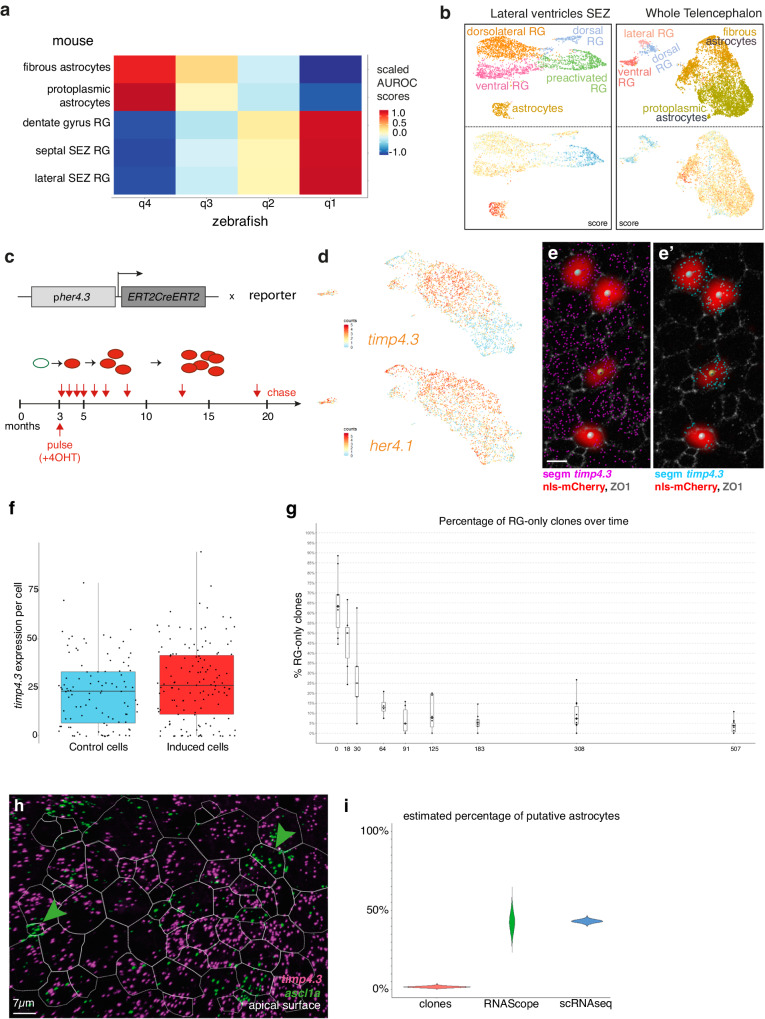
Fig. 4 Transcriptomic and functional homologies between quiescent NSCs in zebrafish and mammalian astrocytes.

a Cluster mapping between zebrafish dorsal RG (this study) and astroglia in the mouse telencephalon. Colors: scaled AUROC scores. b Scoring of mouse astroglial cells from10 (left) and53 (right) for genes enriched in zebrafish q4 over q2. Top: annotated clustering of astroglia from each dataset. Bottom: Enrichment score for orthologs of genes overexpressed in zebrafish q4 over q2. c Scheme of the clonal recombination and chase times used to assess the neurogenic potential of q4 RG. d UMAP comparing timp4.3 and her4.1 expression in qRG. Colors: variable counts. e, f, Quantitative analysis of timp4.3 expression in clones at 6dpi. e,e’, Representative image of recombined cells (mCherry immunohistochemistry -IHC-, red, large spot) in Dm (ZO1 IHC, white, to delimit apical NSC surfaces), with whole-mount RNAscope for timp4.3. timp4.3 dots are segmented in all apical cells (e, magenta) or shown only in recombined clones (e’, cyan). Scale bar 5 μm. ftimp4.3 expression (number of dots) in non-recombined (control) vs recombined (induced) cells at 6dpi (see Source Data file). For each boxplot: lower and upper bounds: 25th and 75th percentiles, internal line: median, whiskers extend to the extrema. Individual values overlaid as black dots. n = 135 and 103 for induced and control cells respectively. Statistical comparison: Two-sided Mann-Whitney U test, p:0.07; effect size: Cliff’s delta (0.14) with a 95% confidence interval (−0.01, 0.28). g Proportion of clones per hemisphere containing only RG over time. Boxplots drawn as in f. n = 10, 6, 5, 4, 6, 11, 9, 10, 11 clone-containing hemispheres at 6, 18, 30, 64, 91, 125, 183, 308, 507 days respectively (see Source Data file). h Representative image of smISH for ascl1a (green) and timp4.3 (magenta) in adult zebrafish Dm (dorsal view). ZO1 IHC delimits apical NSC surfaces (dotted lines). Scale bar 7 μm. i Boostrapped estimate of the proportion of RG-only clones after a 507-day chase (red), versus proportions of q4 cells, estimated in situ with RNAScope (green) or in scRNAseq (blue).

Acknowledgments
This image is the copyrighted work of the attributed author or publisher, and ZFIN has permission only to display this image to its users. Additional permissions should be obtained from the applicable author or publisher of the image. Full text @ Nat. Commun.