
|
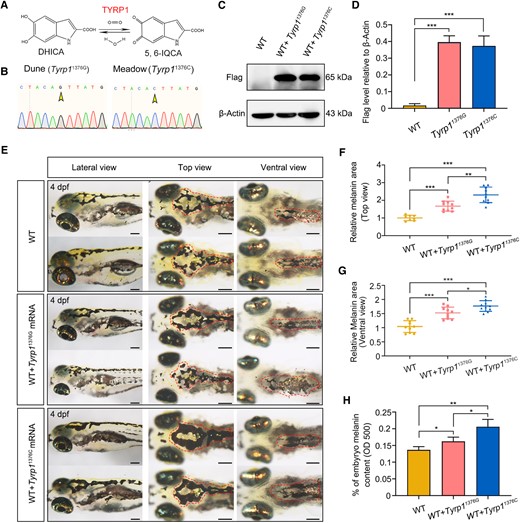
Fig. 4 Verification of the effect of Tyrp1 variations on coloration in the zebrafish system. a) Diagram of the TYRP1 catalytic reaction equation. b) The sequencing base peak of constructed Tyrp11376G (light color/dune population) and Tyrp11376C (dark color/alpine meadow population) OE vectors. The base changes are denoted by yellow arrowheads. c) Protein level of Flag-tagged TYRP1 in the WT, Tyrp11376G (light/dune), and Tyrp11376C (dark/meadow) mRNA OE groups detected by western blot. d) Quantification of protein level in (c) by using Gel-Pro analyzer. Data are shown as mean ± SD. ***P < 0.001. e) The representative bright-field images of zebrafish embryo melanin enriched area at 4 dpf in WT, Tyrp11376G and Tyrp11376C mRNA OE groups. The red dashed areas indicate regions with melanin enriched. From left to right panels are lateral, dorsal, and ventral views (scale bar, 200 μm). f) Quantification of relative melanin area of dorsal views in (e) by Image-Pro Plus analyses. Data are shown as mean ± SD. N (WT) = 8, N (Tyrp11376G OE embryo) = 10, N (Tyrp11376C OE embryo) = 10, **P < 0.01, ***P < 0.001. g) Quantification of relative melanin area of ventral views in (e) by Image-Pro Plus analyses. Data are shown as mean ± SD. N (WT) = 10, N (Tyrp11376G OE embryo) =10, N (Tyrp11376C OE embryo) = 10, *P < 0.05, ***P < 0.001. h) Quantification of whole embryo melanin content by using OD 500 absorption assay. Data are shown as mean ± SD. N = 3, *P < 0.05, **P < 0.01.