
|
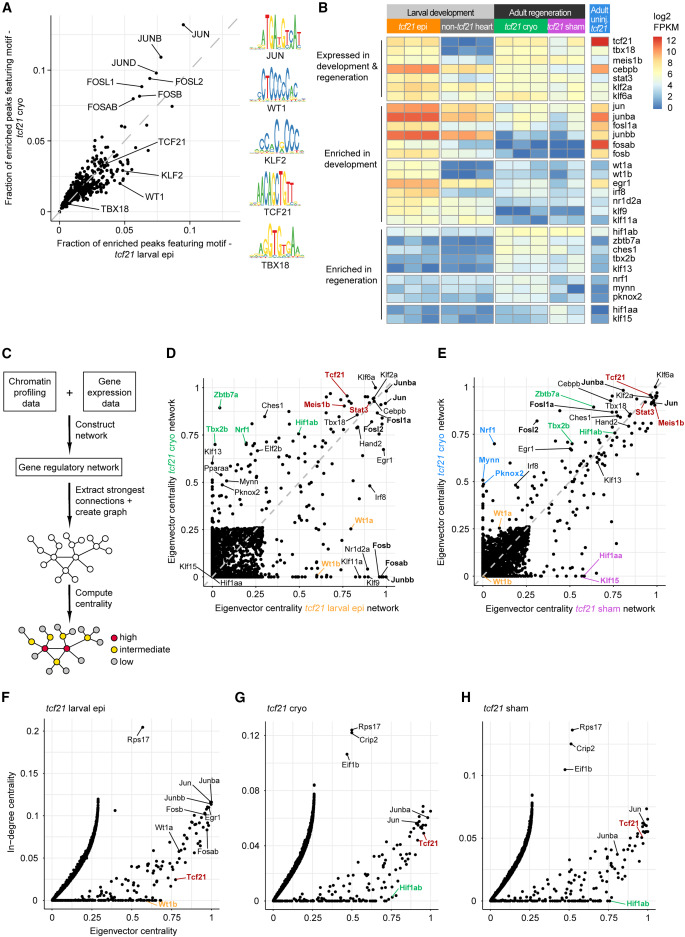
Fig. 5 Gene regulatory networks identify central transcriptional regulators in the developing and regenerating zebrafish epicardia (A) Quantification of TF motif presence in differentially accessible peaks in tcf21 larval epi versus tcf21 cryo. Selected motif logos are shown on the right. (B) Expression of TFs in larval, adult cryoinjured, and sham-treated epicardia. (C) Workflow to construct gene regulatory networks and to identify central regulators. (D and E) Eigenvector centrality in tcf21 larval epi and tcf21 cryo networks (D) and in tcf21 sham and tcf21 cryo networks (E). TFs with enriched centrality in cryoinjured epicardium are shown in blue, TFs with enriched centrality in sham-treated epicardium in purple. (F–H) In-degree centrality versus eigenvector centrality in tcf21 larval epi (F), tcf21 cryo (G), and tcf21 sham (H) sub-networks. In (D–H), selected regulators of both larval and adult epicardium are shown in red, regulators of larval epicardium in yellow, regulators of adult epicardium in green. In (D) and (E), AP-1 components are labeled in bold letters. Epi, epicardium. See also Figures S3 and S4.
Reprinted from Developmental Cell, 59(3), Weinberger, M., Simões, F.C., Gungoosingh, T., Sauka-Spengler, T., Riley, P.R., Distinct epicardial gene regulatory programs drive development and regeneration of the zebrafish heart, 351-367.e6, Copyright (2024) with permission from Elsevier. Full text @ Dev. Cell