
Image
|
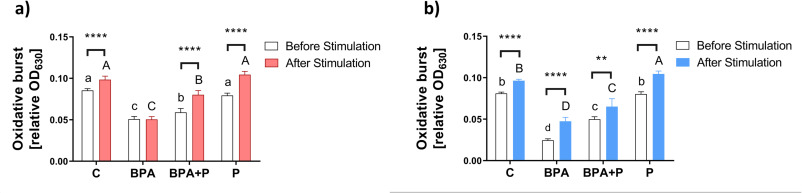
Figure Caption
Fig. 4 Respiratory Burst Assay. Spleen respiratory burst assay in the different experimental groups before (white) and after stimulation with PMA [red in female (a) and blue in male (b)]. Data are reported as mean ± standard deviation (SD). Asterisks indicate statistically significant differences before and after PMA stimulation (**P < 0.01, ****P < 0.0001), whereas lower-case letters indicate statistically significant differences among the groups before stimulation and upper-case letters after the stimulation (n = 6, P < 0.05). Letter “a” and “A” has been assigned to the highest value.
Acknowledgments
This image is the copyrighted work of the attributed author or publisher, and
ZFIN has permission only to display this image to its users.
Additional permissions should be obtained from the applicable author or publisher of the image.
Full text @ Sci. Total Environ.