
|
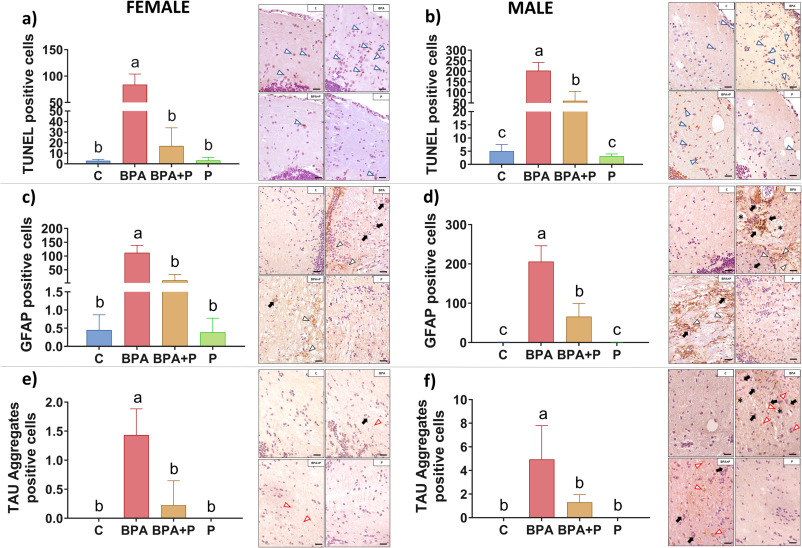
Fig. 3 Brain TUNEL and IHC. a,b) TUNEL, c,d) GFAP and e,f) TAU aggregates positive cells of female and male brains respectively, in different experimental groups. Data are reported as mean ± standard deviation (SD). Groups with the same letters do not present statistically significant differences among them, whereas groups with different letters do present statistically significant differences among them (P < 0.05) (n = 6 for C and BPA in both sexes and for BPA + P and P male, n = 4 for P female and n = 8 for BPA + P female). Letter “a” has been assigned to the highest value. Microphotographs show representative images of TUNEL, GFAP and TAU in the female (left) and male (right) brain sections. Scale bar = 200 μm.