
|
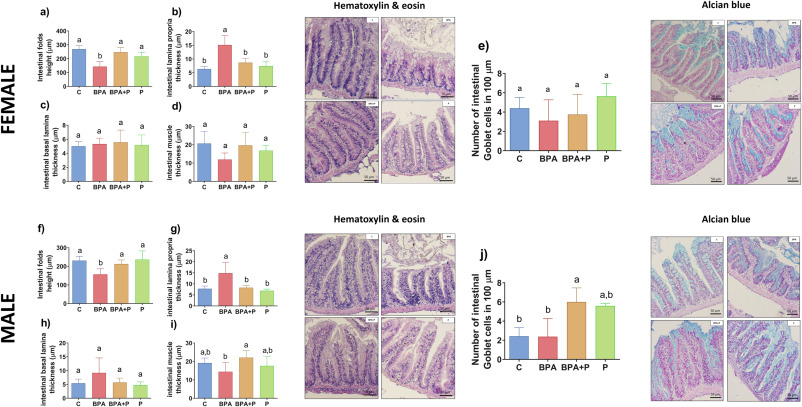
Fig. 1 Histological evaluation of gut samples. a,f) Intestinal Fold Height (μm), b,g) Intestinal Lamina Propria Thickness (μm), c,h) Intestinal Basal Lamina Thickness (μm), d,i) Intestinal Muscle Thickness (μm) and e,j) Number of intestinal goblet cells counted in 100 μm of fold length in female and male gut respectively, in the different experimental groups. Data are reported as mean ± standard deviation (SD) (n = 6). Letter “a” has been assigned to the highest value. Groups with the same letters do not present statistically significant differences among them, whereas groups with different letters do present statistically significant differences among them (P < 0.05). Groups labeled with two letters do not present statistically significant differences with other groups presenting either of them. Microphotographs show representative hematoxylin and eosin and alcian blue stainings in the different experimental groups. Scale bar = 50 μm.