
|
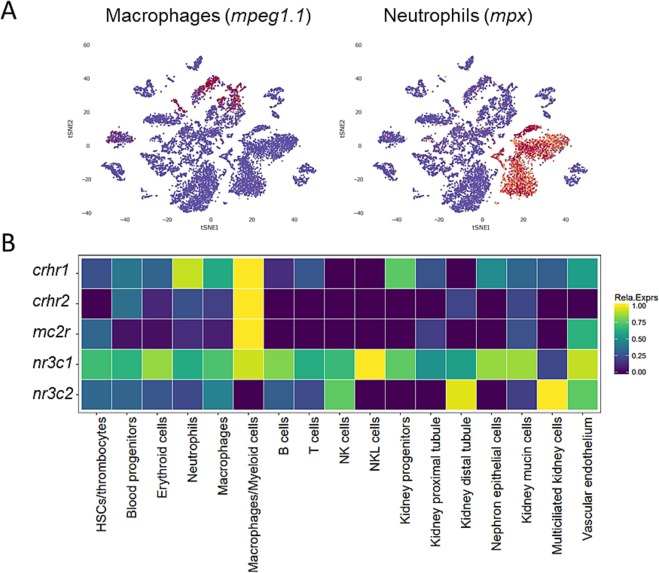
Fig. 1 Distribution of stress hormone receptors in immune cells. This figure is derived from single-cell RNA sequencing data from adult zebrafish kidney samples, publicly available at https://molpath.shinyapps.io/zebrafishblood/#pltly (Tang et al., 2017). A) Clustering of single-cell RNA-seq data using tSNE2, shows distinct populations of immune cells, where macrophage populations express macrophage-expressed gene 1.1 (mpeg1.1) and neutrophil populations express myeloid-specific peroxidase (mpx). B) The gr (nr3c1) gene is globally expressed in all detected cells, while crhr1 is also expressed in neutrophils, macrophages, and T-cells, and mr (nr3c2), mc2r and crhr2 are expressed most highly in myeloid cells/macrophages, and in small amounts in other cell types.