
|
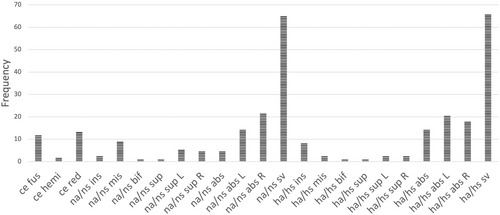
Fig. 2 Histogram of the frequency of specimens displaying different phenotypes in the caudal region of the vertebral column. ce fus, complete fusion; ce hemi, hemivertebra; ce red, reduction in length of the centrum; na/ns ins, misplacement of neural arch insertion; na/ns mis, mismatched fusion of neural spines of two different centra; na/ns bif, bifid neural spine; na/ns sup (L/R), supernumerary (L/R) arch/spine; na/ns abs (L/R), absent neural arch/spine; na/ns sv, neural arch/spine shape variation; ha/hs ins, misplacement of haemal arch insertion; ha/hs mis, mismatched fusion of haemal spines of two different centra; ha/hs bif, bifid haemal spine; ha/hs sup (L/R), supernumerary (L/R) haemal arch/spine; ha/hs abs (L/R), absent haemal arch/spine; ha/hs sv, haemal arch/spine shape variation