
|
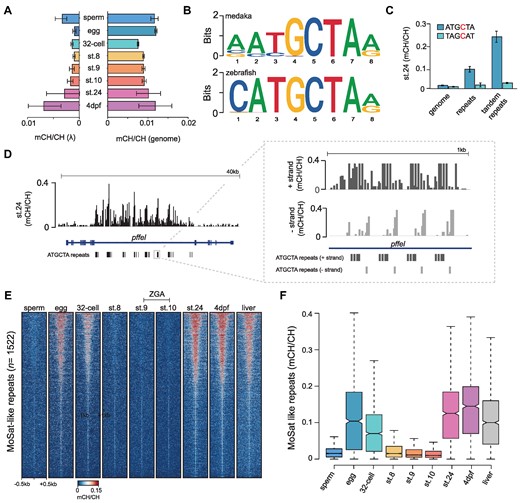
Fig. 3 CH methylation dynamics during medaka embryo development. (A) Global CH methylation levels (mCH/CH) in the medaka genome and in spike-in lambda (λ) controls during embryonic development. Data is represented as the mean of two WGBS biological replicates with error bars indicating the standard error. (B) The topmost enriched motif from 10000 most methylated CH sites in st.24 medaka embryos and 24hpf zebrafish embryos. (C) CH methylation levels (mCH/CH) at ATGCTA and its complement TAGCAT nucleotides in the genome, repeat elements, and tandem repeat elements in st.24 medaka embryos. Data is represented as the mean of two WGBS biological replicates with error bars indicating the standard error. (D) IGV browser snapshot of mCH/CH levels at ATGCTA repeats in st.24 medaka embryos with the right panel displaying a zoomed-in view of mCH/CH levels in a strand-specific manner. (E) Heatmap of CH methylation levels (mCH/CH) at ATGCTA-containing tandem repeats (MoSat-like repeats), in developing medaka embryos. (F) Distribution of CH methylation (mCH/CH) levels at ATGCTA containing tandem repeats (MoSat-like repeats) in developing medaka embryos. The boxplots show the median (centre line) and the first and third quartiles (Q1 and Q3; box limits), and the whiskers extend to the last point within 1.5X of the interquartile range below and above Q1 and Q3, respectively.