
|
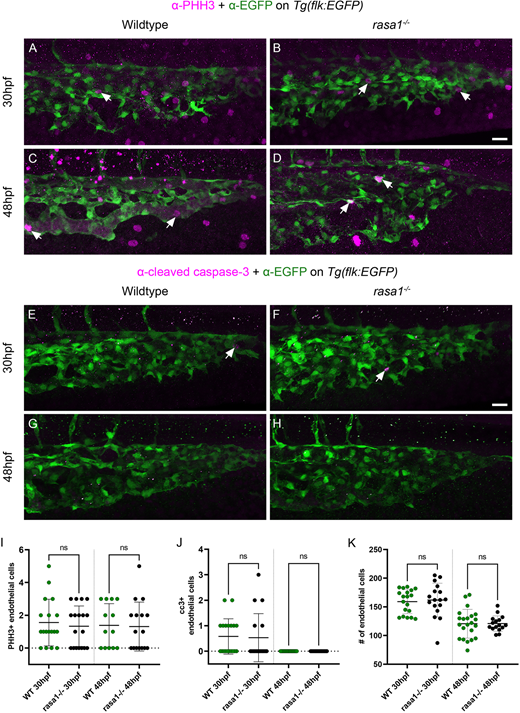
Fig. 6 Proliferation and cell death do not drive AVM formation in rasa1 mutants. (A-D) Antibody staining of proliferative endothelial cells [arrows; phospho-histone H3 (PHH3)]. (E-H) Antibody staining of apoptotic endothelial cells [arrows; cleaved caspase 3 (cc3)]. No cc3 was observed in endothelium at 48 hpf. (I) PHH3 staining does not differ at 30 hpf or 48 hpf when compared with controls (30 hpf: wild type, 1.6 cells, n=18; rasa1−/−, 1.3 cells, P=0.98, n=18; N=2 experiments; 48 hpf: wild type, 1.4 cells, n=13; rasa1−/−, 1.3 cells, P>0.99, n=16; N=2 experiments). (J) There are no differences between wild types and mutants in cc3 staining (30 hpf: wild type, 0.6±0.7 cells, n=19; rasa1−/−, 0.5 cells, P>0.99, n=17; N=2 experiments; 48 hpf: wild type, 0 cells, n=22; rasa1−/−, 0 cells, P>0.99, n=17; N=2 experiments). (K) Endothelial cell counts reveal no significant difference in cell number between wild types and mutants at either timepoint (30 hpf: wild type, 159.2 cells, n=19; rasa1−/−, 161.9 cells, n=17, P=0.99; N=2 experiments; 48 hpf: wild type, 120.6 cells, n=22; rasa1−/−, 120.8 cells, n=17, P>0.99; N=2 experiments). Statistical analysis was carried out using one-way ANOVA with Sidak's correction. Data are mean±s.d. Scale bars: 20 µm.