
|
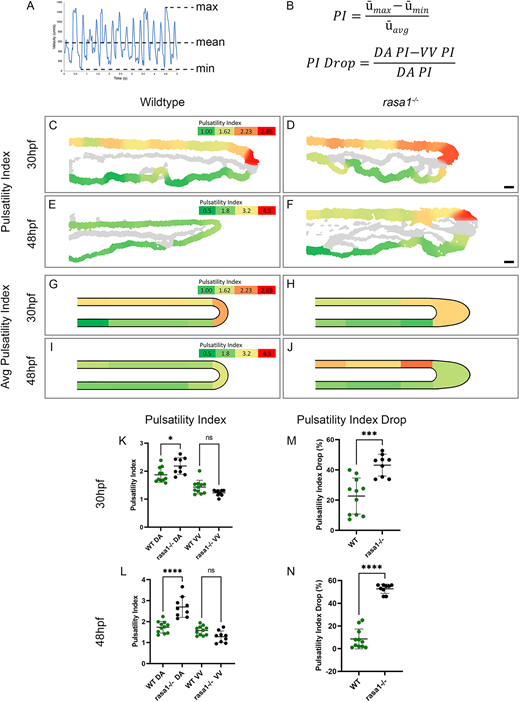
Fig. 3 Blood flow pulsatility is affected by vascular lesions in rasa1 mutants. (A,B) Diagram and equations illustrating how the pulsatility index (PI) and PI drop were calculated. (C-F) PI heatmaps of representative wild-type and rasa1 mutant embryos. (G-J) Average PI heatmaps of wild-type and rasa1 mutant embryos. (K,L) PI at 30 hpf and 48 hpf, respectively, of wild types and rasa1 mutants in the dorsal aorta (DA) and ventral vein (VV). (M,N) PI drop at 30 hpf and 48 hpf, respectively, of wild type and rasa1 mutants in the DA and VV. Statistical analysis was carried out using one-way ANOVA with Sidak's correction. Data are mean±s.d. Scale bars: 20 µm.