
|
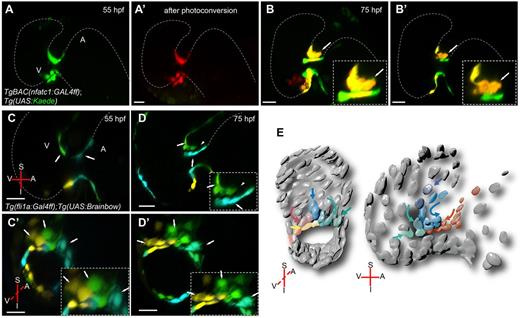
Fig. 3 Endocardial cell movements from the atrium and ventricle contribute to cardiac valve formation. 3D sagittal projection of a TgBAC(nfatc1:GAL4ff);Tg(UAS:Kaede) heart before (A) and after (A′) photoconversion at 55 hpf. Strong ‘nfatc1’ expression can be detected at the AVC. 3D projection (B) and optical section (B′) of the heart shown in A at 75 hpf. Arrows in B and B′ indicate forming valve. New green cells can be observed at the AVC indicating a contribution of nfact1-positive cells from outside the AVC to the valve region. Red fluorescent cells remain at the AVC. Magnifications of the forming valve are shown in B and B′, insets. (C,D) Sagittal planes of a Tg(fli1a:Gal4ff);Tg(UAS:Brainbow) heart. Embryos were injected with Cre mRNA at the one-cell stage and imaged at 55 (C) and 75 (D) hpf. Green fluorescent cells located in the ventricle at 55 hpf (C, green, arrow) appear to move towards the AVC (D). A subset of these cells can be detected in the abluminal side of the valve (D, arrowhead). Cyan fluorescent cells in the atrium also appear to move towards the AVC (D). However, these cells appear to join the group of cells lining the AVC lumen (D, cyan, arrow). (C′,D′) Transverse planes of the same datasets as in C and D, respectively. (E) A model of the deduced cell movements. A, atrium; I, inferior AVC; S, superior AVC; V, ventricle. Scale bars, 20 µm.