
|
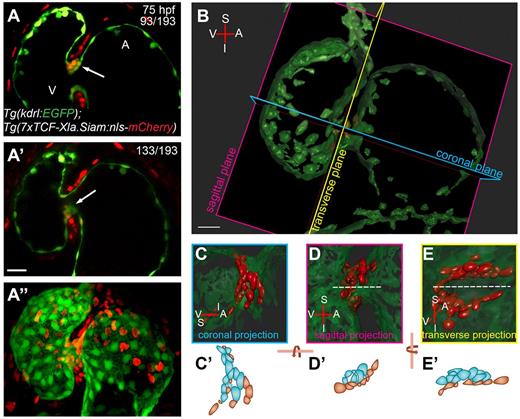
Fig. 1 3D analysis of cardiac valve formation. (A-A″) z-stack of a 75 hpf Tg(kdrl:EGFP);Tg(7xTCF-Xla.Siam:nls-mcherry) heart; ventral view. Coexpression of endothelial-specific EGFP and TCF-driven mCherry marks the valve-forming cells in the single-plane images. Coexpression marking the superior part of the AVC is shown in z-stack plane 93 (A, arrow) and colocalization marking the inferior part of the AVC is shown in z-stack plane 133 (A′, arrow). Maximum projection of the z-stack is shown in A″. (B) 3D volume rendering of dataset from A. Note that Imaris software was used to remove the mCherry signal not co-occurring or overlapping with EGFP, so that only endocardial mCherry+ cells are shown. The coronal, sagittal and transverse planes of the heart were defined based on the orientation of the linear heart tube. (C-E) Close ups of the 3D volume rendered views in coronal, sagittal and transverse projections, respectively. The superior immature valve is above the dashed line in D and E. (C′,D′,E′) Cartoons of TCF:mCherry+ endocardial cells of the superior half of the AVC. Cells colored in blue represent abluminal cells (ALCs) and cells colored in reddish brown represent luminal cells (LCs). A, atrium; I, inferior AVC; S, superior AVC; V, ventricle. Scale bar: 20 µm.