
Image
|
Figure Caption
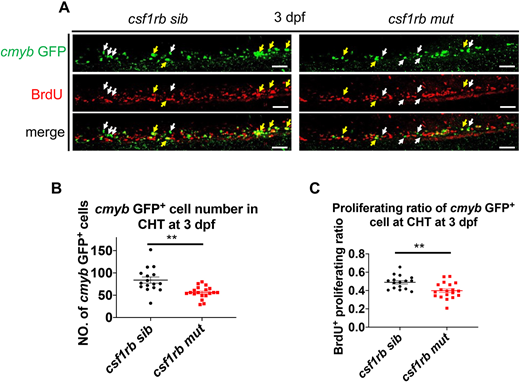
Fig. 3 Csf1rb deficiency impairs the proliferation capacity of HSPCs. (A) Immunostaining of cmyb-GFP (green) and BrdU (red) in the CHT at 3 dpf in siblings and csf1rb mutants after BrdU labeling for 1 h. Yellow arrows show BrdU+ HSPCs, white arrows indicate GFP single-positive HSPCs. Scale bars: 20 μm. (B) Quantification of cmyb-GFP+ HSPCs in the CHT at 3 dpf in siblings (n=16) and csf1rb mutants (n=19). (C) Quantification of the proliferation ratio of cmyb-GFP+ HSPCs in the CHT at 3 dpf in siblings (n=16) and csf1rb mutants (n=19). Data are presented as mean±s.e.m. **P<0.01.
Figure Data
Acknowledgments
This image is the copyrighted work of the attributed author or publisher, and
ZFIN has permission only to display this image to its users.
Additional permissions should be obtained from the applicable author or publisher of the image.
Full text @ Development