
Image
|
Figure Caption
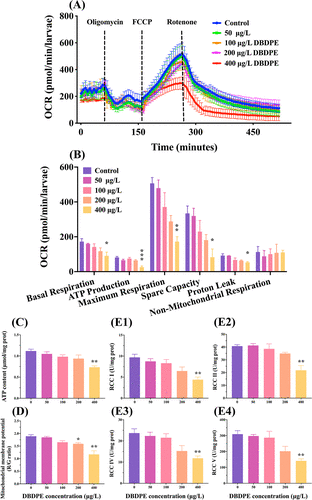
Fig. 3 (A) Mitochondrial stress test (MST) was performed on Seahorse; (B) mitochondrial activity parameters were measured from MST; changes in (C) ATP content, (D) MMP, and (E) mitochondrial respiratory chain complex I, II, IV, and V activities in zebrafish larvae after exposure to DBDPE for 120 h. Values are presented as the mean ± SEM of four replicates. Values are shown as the mean ± SEM of four replicates. *P < 0.05, **P < 0.01, and ***P < 0.001 indicate significant differences between the exposure and control groups.
Acknowledgments
This image is the copyrighted work of the attributed author or publisher, and
ZFIN has permission only to display this image to its users.
Additional permissions should be obtained from the applicable author or publisher of the image.
Full text @ Env. Sci. Tech.