
Image
|
Figure Caption
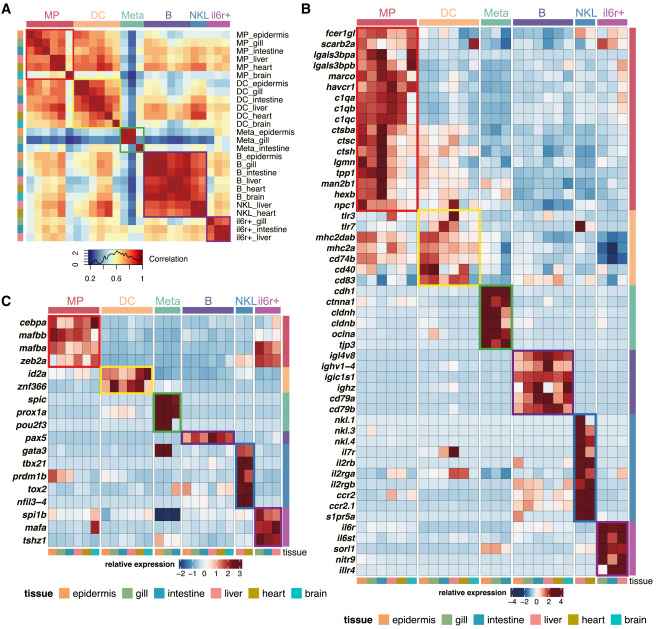
Fig. 2 Cross-organ assessment of mpeg1.1+ populations (A) Pearson correlation analysis between the average gene expression level of mpeg1.1+ populations across six organs. The strength of the correlation is depicted by a color scale, with the highest correlation shown in red. (B) Heatmap showing the relative expression level of the signature genes for each mpeg1.1+ population across organs. (C) Heatmap showing the relative expression level of highlighted transcription factors in mpeg1.1+ populations across organs. See also Table S2.
Acknowledgments
This image is the copyrighted work of the attributed author or publisher, and
ZFIN has permission only to display this image to its users.
Additional permissions should be obtained from the applicable author or publisher of the image.
Full text @ Cell Rep.