
|
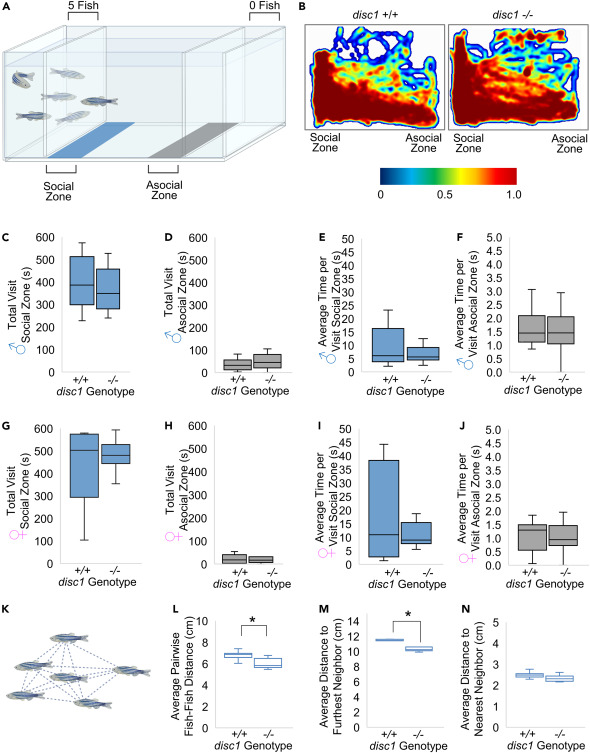
Fig. 8 Adult disc1 mutants exhibit a preference for being part of a shoal (A) Diagram of behavioral testing arena. (B) Heat maps depicting the amount of time spent at each location in the testing arena by a representative WT sibling and disc1 mutant (red indicates increased time and blue indicates decreased time). (C-F) Total visit time to the social zone, (D) total visit time to the asocial zone, (E) average time per visit to the social zone, and (F) average time per visit to the social zone in males WTs (n = 16) and male disc1 mutants (n = 16). (G-K) Total visit time to the asocial zone, (H) total visit time to the asocial zone, (I) average time per visit to the asocial zone, and (J) average time per visit to the asocial zone in females WTs (n = 16) and female disc1 mutants (n = 16). (K) Pairwise interactions measured in the shoal cohesion assay (n = 18; 3 males and 3 females per shoal). (L-N) Average pairwise fish-fish distance, (M) average distance to the furthest neighbor, and (N) average distance to the nearest neighbor. ∗ = p < 0.01. Data are presented as box and whisker plots. The box in the plot represents the 25th percentile to the 75th percentile, the line across the box represents the median, and the whiskers are the maximum and minimum data-point values.