IMAGE

Figure EV1

ID
ZDB-IMAGE-231116-139
Source
Figures for Finotto et al., 2023
Image
Figure Caption

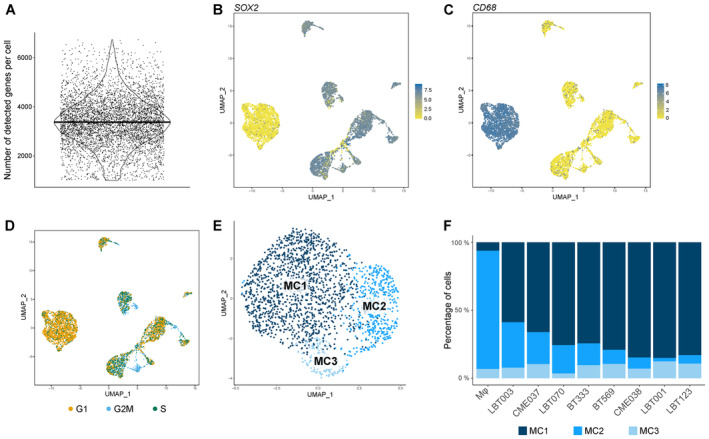
Figure EV1 Single‐cell profiling of GSCC‐macrophage co‐cultures reveals molecular heterogeneity of GBM‐associated macrophages

Violin plot showing the number of detected genes per cell (n = 5,320 cells from nine samples with a median of 3,334 genes detected per cell).

UMAP plots showing SOX2 (B) and CD68 (C) expression.

UMAP plot showing cell cycle score. Proliferating GBM tumor cells are depicted in blue.

UMAP plot of macrophage population identified three distinct macrophage subclusters (MC1‐3).

Macrophage subcluster distribution for the different samples. mφ, macrophages.

Source data are available online for this figure.

Acknowledgments
This image is the copyrighted work of the attributed author or publisher, and ZFIN has permission only to display this image to its users. Additional permissions should be obtained from the applicable author or publisher of the image. Full text @ EMBO Mol. Med.