
|
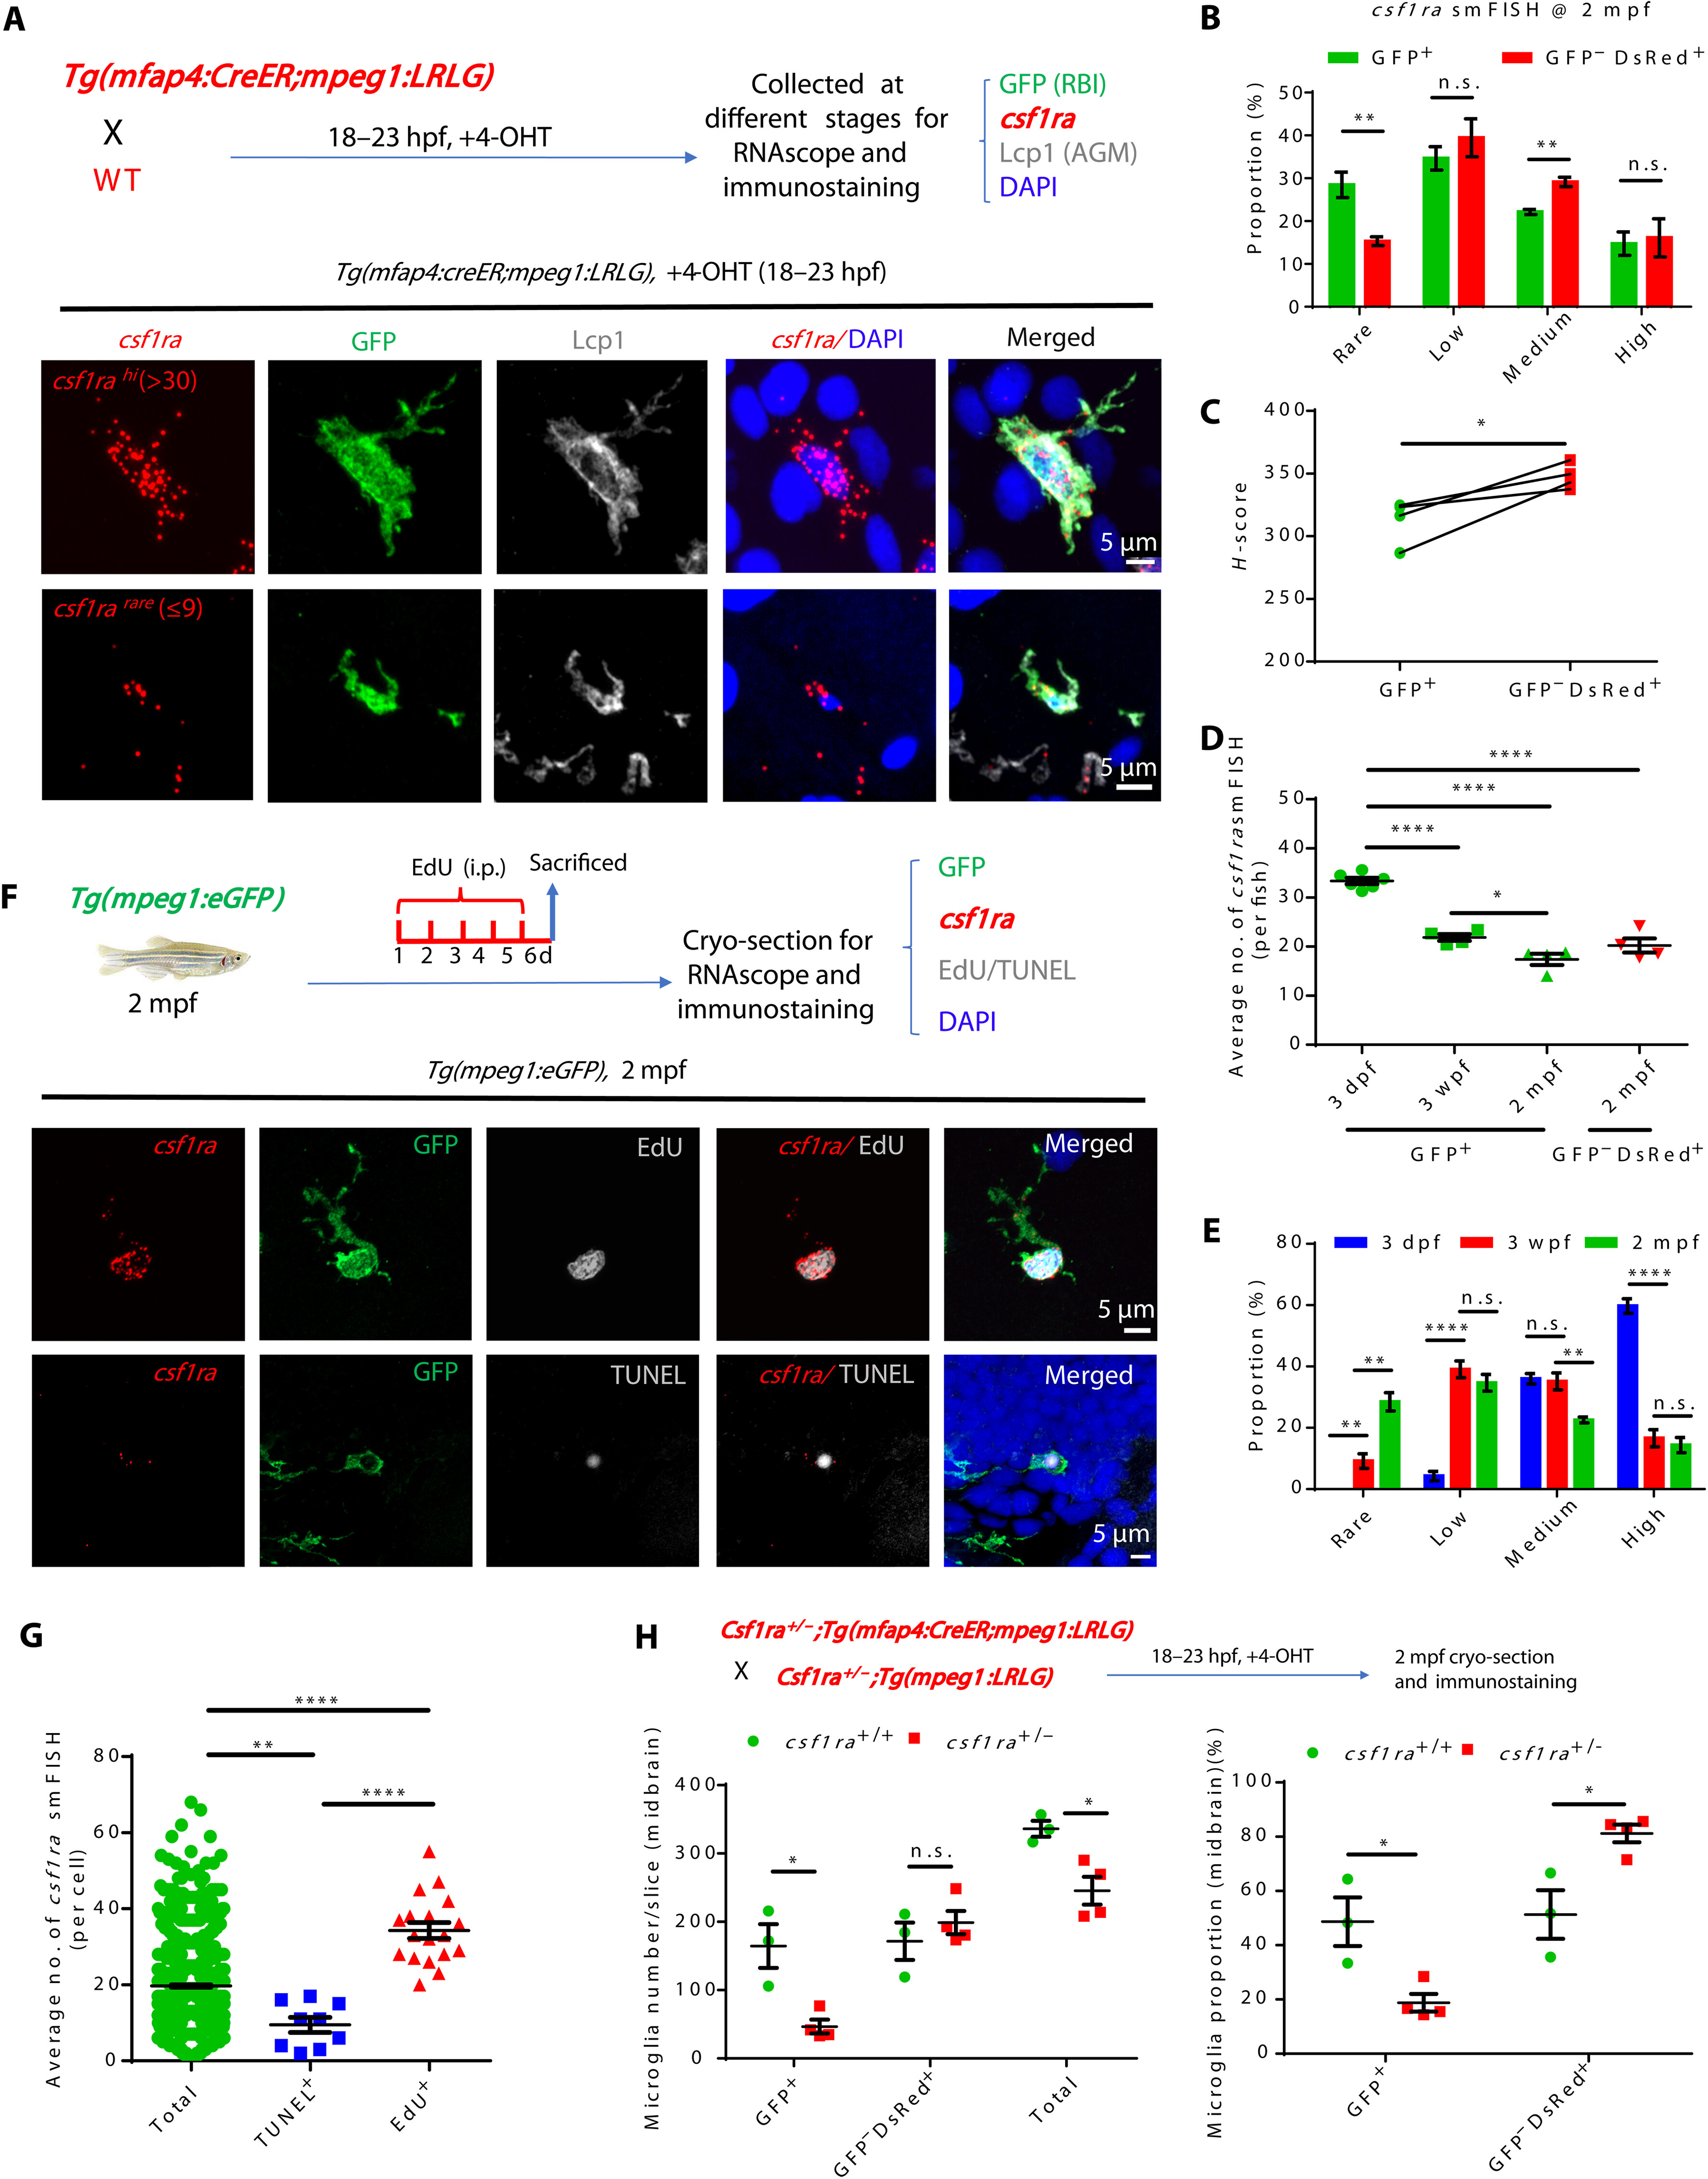
Fig. 5 Age-dependent decline of csf1ra expression accounts for the less competitiveness of RBI microglia. (A) Diagram shows the design for RNAscope smFISH (red), anti-GFP (green), anti-Lcp1 (white), and DAPI (blue) staining (top) and the representative images of RBI microglia with high and rare csf1ra expression (bottom). (B) Quantification of four categories of RBI and AGM microglia expressing different csf1ra levels at 2 mpf (n = 4). (C) H-score quantification of csf1ra expression levels in RBI and AGM microglia (n = 4). (D) Average number of csf1ra smFISH dots in 3-dpf, 3-wpf, and 2-mpf RBI microglia and in 2-mpf AGM microglia (3 dpf n = 6, 3 wpf n = 4, 2 mpf n = 4). (E) Quantification of four categories of RBI microglia expressing different csf1ra level (3 dpf n = 6, 3 wpf n = 4, 2 mpf n = 4). (F) Diagram shows the experimental setup for RNAscope smFISH (red), anti-GFP (green), EdU or TUNEL (white), and DAPI (blue) staining (top) at 2 mpf, and representative images show the expression of csf1ra in EdU+GFP+ and TUNEL+GFP+ microglia at 2 mpf (bottom). (G) Quantification of csf1ra smFISH dots in EdU+GFP+, TUNEL+GFP+, and GFP+ (total) microglia in (F) (total n = 1255, TUNEL+ n = 9, EdU+ n = 18). (H) Diagram shows the design for RBI microglia tracing in WT, csf1ra+/−, and csf1ra−/− mutants (top) and quantification of the number and proportion of RBI (GFP+) and AGM (GFP−DsRed+) microglia in WT and csf1ra+/− fish at 2 mpf (WT n = 3, csf1ra+/− n = 4). n.s., P > 0.05; *P < 0.05; **P < 0.01; ****P < 0.0001 (Student’s t test). Data were presented as mean ± SEM.