
|
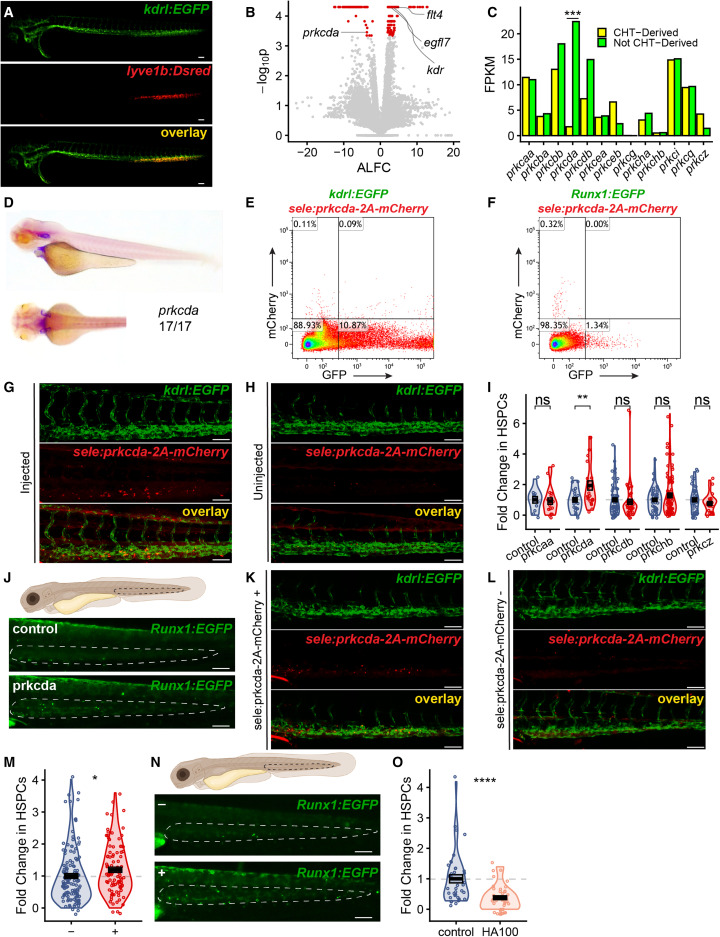
Fig. 1 Transcription of prkcda is repressed in the vascular niche and dysregulated expression of prkcda expands phenotypic HSPCs (A) Representative images of the kdrl:EGFP; lyve1b:DsRed transgenic line. Bar, 100 μm. (B) Volcano plot indicating genes with significantly differentially regulated genes in red; prkcda and selected CHT-specific genes are shown. Positive absolute log fold change (ALFC) indicates upregulation in CHT-derived sinusoidal endothelial cells compared to non-CHT-derived arteriovenous endothelial cells. (C) Differential expression of PKC-family genes in CHT-derived and non-CHT-derived endothelial cells. Values represent average fragments per kilobase of exon per million mapped fragments (FPKM) from three biological replicates. For prkcda, p = 0.00035. (D–F) Whole-mount in situ hybridization for prkcda in 72-hpf zebrafish embryos. (E and F) Flow cytometric analysis of kdrl:EGFP;sele:prkcda-2A-mCherry (E) and Runx1:EGFP;sele:prkcda-2A-mCherry (F) embryos. (G and H) Representative images of kdrl:EGFP zebrafish embryos injected (G) or not (H) with the sele:prkcda-2A-mCherry expression construct. Bar, 100 μm. (I) Dysregulated expression of prkcda in Runx1:EGFP;sele:prkcda-2A-mCherry embryos expands HSPCs. Each PKC family member is compared to clutchmates injected with a vector containing an empty multiple cloning site (control). Data are presented as fold change relative to control for each clutch (two or three clutches analyzed per PKC family member; each point represents a biological replicate). Boxes represent mean ± SEM. Prkcda vs. control: 1.94 ± 0.3-fold increase, p = 0.0092, Welch’s t test. (J) Representative images of CHT colonization in control and prkcda groups. Dotted lines indicate the CHT. Bar, 100 μm. (K and L) Representative images of kdrl:EGFP(+) sele:prkcda-2A-mCherry(+) (K) and kdrl:EGFP(+); sele:prkcda-2A-mCherry(−) (L) transgenics. Bar, 100 μm. (M) Phenotypic HSPCs were quantified in stable Runx1:EGFP;sele:prkcda-2A-mCherry transgenics (+) and Runx1:EGFP clutchmates (−) at 72 hpf. Data are pooled from two independent clutches and are represented as fold change relative to (−). Boxes represent mean ± SEM; each point represents a biological replicate. + vs. −: 1.19 ± 0.08-fold increase, p = 0.014, Wilcoxon rank-sum test. (N) Representative images of CHT colonization for the (−) and (+) animals from Figure 1G. Dotted lines indicate CHT. (O) Phenotypic HSPCs were quantified in Runx1:EGFP transgenics treated with HA-100 or an equivalent volume of DMSO as a vehicle control. Data are pooled from two independent experiments and are shown as fold change relative to control. Box represents mean ± SEM; each point represents a biological replicate. HA-100 vs. control: 0.38 ± 0.06-fold decrease, p = 8.3 × 10⁻⁶, Wilcoxon rank-sum test. See also Figure S1 and Table S1.