
Fig. 6
- ID
- ZDB-IMAGE-231102-26
- Publication
- Zhao et al., 2023 - Metaphocytes are IL-22BP-producing cells regulated by ETS transcription factor Spic and essential for zebrafish barrier immunity
- All Figures
- Figures for Zhao et al., 2023
|
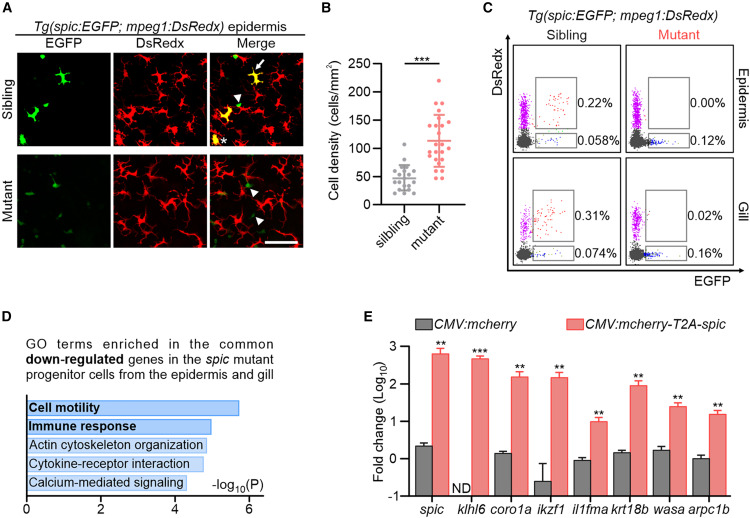
Fig. 6 spic deficiency blocks progenitor differentiation (A) Representative images of the epidermis of Tg(spic:EGFP;mpeg1:DsRedx);spicΔ136 mutants and siblings. The arrow indicates the mature metaphocytes and the asterisk indicates the immature metaphocytes. The arrowheads indicate the progenitor cells. Scale bar, 50 μm. (B) The density of progenitor cells in the epidermis of spicΔ136 mutants and siblings. Values are represented as mean ± SD (n of siblings is 20; n of mutants is 24). ∗∗∗p < 0.001. (C) Representative images of FACS analysis of metaphocytes and progenitor cells in the epidermis and gill of spicΔ136 mutants and siblings. (D) GO terms enriched in the common downregulated genes of mutant progenitor cells in the epidermis and gill. (E) Fold change of gene expression after ectopic overexpression of spic or mCherry in zebrafish embryos. Values are represented as mean ± SD (n = 4). ∗∗p < 0.01, ∗∗∗p < 0.001. ND, not detected. See also Figure S4.