
|
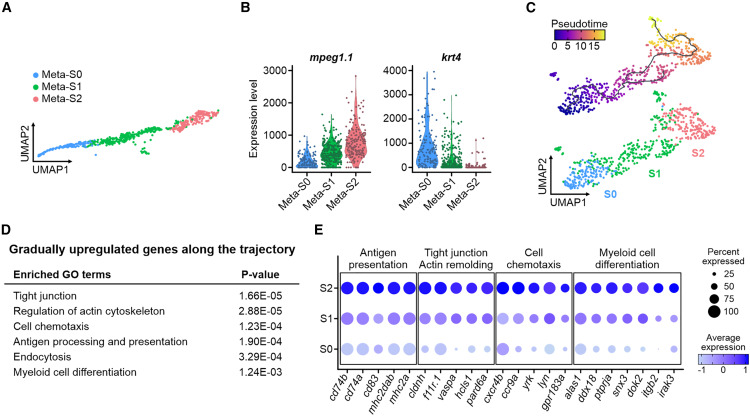
Fig. 5 scRNA-seq transcriptome profiling of metaphocyte development (A) Uniform Manifold Approximation and Projection clustering of spic:EGFP+ cells identified metaphocytes of different states. Meta, metaphocytes. (B) CPM value of mpeg1.1 and krt4 in metaphocytes of different stages. (C) Pseudotime trajectory analysis of spic:EGFP+ cells. Metaphocytes of S0, S1, and S2 are sequentially aligned along the pseudotime trajectory. (D) GO terms enriched in the genes gradually upregulated along the pseudotime trajectory. (E) Relative expression of gradually upregulated genes in metaphocytes of different stages. See also Figure S3.