
|
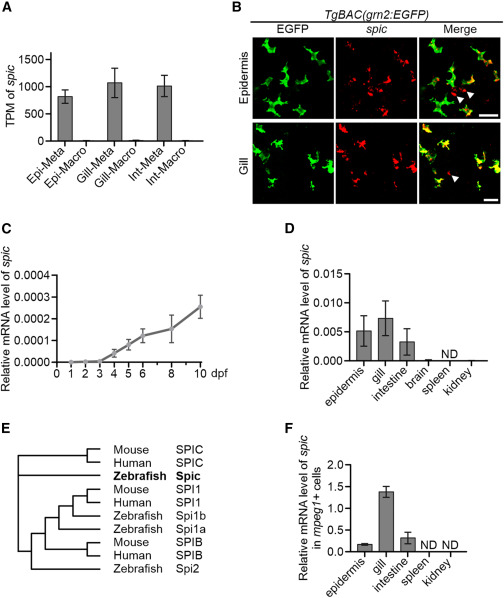
Fig. 1 spic is highly enriched in metaphocytes (A) TPM values of spic in metaphocytes and macrophages of zebrafish barrier tissues by bulk RNA-seq. Values are represented as mean ± SD (n ≥ 7). Epi, epidermis; Int, intestine; Meta, metaphocytes; Macro, macrophages. (B) ISH detection of spic in the epidermis and gill of TgBAC(grn2:EGFP) fish. Arrowheads indicate the spic signals that are not co-stained with the EGFP+ metaphocytes. Scale bars, 20 μm. (C) qPCR detection of the relative expression level of spic at early development stages of zebrafish. eef1a1l1 was utilized as the internal control. Values are represented as mean ± SD (n = 6). (D) qPCR detection of the relative expression level of spic in adult organs. eef1a1l1 was utilized as the internal control. Values are represented as mean ± SD (n ≥ 3). ND, not detected. (E) Phylogenetic analysis of PU.1-related transcription factors from the zebrafish, mouse, and human. (F) qPCR detection of the relative expression level of spic in mpeg1:DsRedx+ cells from adult organs. eef1a1l1 was utilized as the internal control. Values are represented as mean ± SD (n ≥ 3). ND, not detected. See also Figure S1.